
Page 17 - PFAR Report 2022
P. 17
Construction in Progress Improvements Other Than Buildings Buildings and Fixed Equipment
$ 59 005 037 $ 12 948 786 $ 666 353 058
16
Furniture Fixtures and Equipment
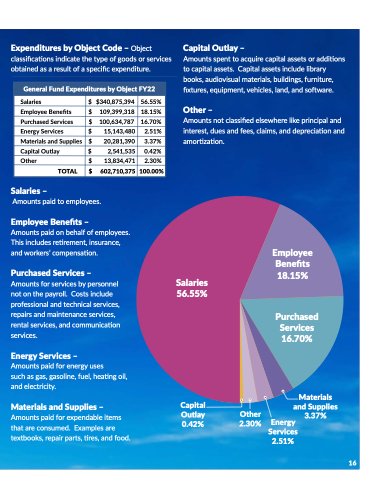
$ ExMpoetnodr Viteuhricelessby Object Object Code –
Object$ claAssVifiMcatiteorniaslsinadnidcaCtoemthpeuteyrpSeooftfwgaoroeds or or or se$rvices
obtained as a a a a resulTtOoTfAaLspecific expenditure $ 13 951 499 14 1C3a4p 1i4t7al Outlay –
Purchased Services Services –
29 254 855
31 958 455
3 65% 3 99% 0 94% 2 2 25%
8 60%
$ 35 538 045 $ 33 097 406
Food Services Services $ Salaries
Amounts for services by personnel
7 7 7 486 774 noSt toundethnet Tpraynrsoplol rtCatioostns in$clu1d8e 042 615
Central Services $ $ 6 6 991 359 5$6 5157 %287 235 2 2 2 17%
2A1m3 o9u3n1ts spent to acquire capital assets or additions 802 9to12c a0p8i0tal assets assets Capital assets assets include library
books audiovisual materials buildings furniture fixtures DeuqeuipnmOennetY veearhicles land and and software Other –
Amounts not classified elsewhere like principal and interest dues and and and fees claims and and and depreciation and and and amortization General Fund Expenditures by Object FY22
Salaries
$ $ $340 875 394
56 55%
Employee Benefits
$ 109 399 318
18
15%
Purchased Services $ 100 634 787
16
70%
Energy Services $ 15
143 480
2 51%
Materials and Supplies
$ 20 281 390
3 3 37%
Capital Outlay $ 2 541 535
0 42%
Other $ 13 834 471
2 30%
TOTAL
$ 602 710 375
100 00%
Salaries
–
Governmental Funds FY20
FY21
$ 463 784 625 58
13%
FY22
$ 502 426 310 58
30%
$ 30 849 977 3 3 58%
$ 15
894 732 1 1 84%
Amounts paid to employees Expenditures Instruction $ 451 475 522 56 37%
$ 26 593 525 3 3 3 32%
Employee Benefits
–
Student Support $ 29 132 349 $ 14 892 441 $ 40 523 926
$ 70 884 312 8 8 8 8 89% $ 6 6 224 260 0 0 78% $ 43 752 638 5 5 48% $ 35 665 339 4 4 47% $ 797 773 935 100 00%
Amounts paid on on behalf of employees 3 65% 1 87% 5 08%
4 4 45% 4 15%
0 88%
GeneralAdministration $ 12 365 190 1 1 1 54%
This includes retirement insurance $ 42 515 037 4 4 93%
SchoolAdministration $ 40 512 588 5 5 5 06% and workers’ compensation Employee $ B3e9n 4e37fi 4t2s6
$ $ $ 1480 4159 %961 $ 15
15
531 785 $ 17 092 186
3 88%
Facilities Acquisition & Construction $ CommunityServices $ 1 959 259 0 25%
4 58%
4 69% 1 80% 1 98%
proOfepsesriaotinoanl a&nd technical services Maintenance of Plant $ 68 68 868 465
8 8 84%
$ 10 079 011 1 1 1 1 1 17%
repairs and maintenance services Purchased Services rental services and communication
$ 33 420 603
$ 70 979 149
$ 41 361 206
$ 800 857 603
100 00%
Amounts paid for energy uses
such as as as gas gas gasoline fuel heating oil and electricity Capital Materials and Supplies
–
Outlay Amounts paid for expendable items 0 42%
that are are consumed Examples are are textbooks repair parts tires and food Other Capital Outlay 8 8 86% 5 17%
services 16
70%
$ 76 140 093
Debt Service 4 4 41%
TOTAL
Energy Services –
Other 2 30%
Materials and Supplies
$ 38 007 327
$ 861 814 448 100 00%
Energy Services 2 51%
3 3 37%
