
Page 8 - PFAR Report 2022
P. 8
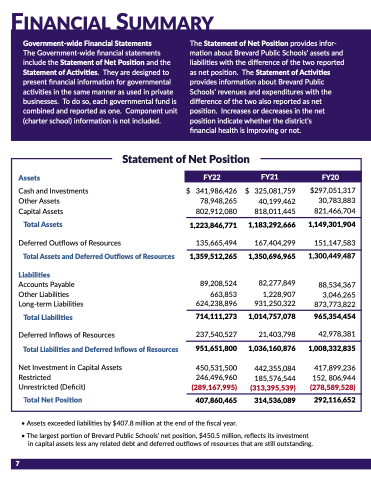
FINANCIAL SUMMARY
Government-wide Government-wide Financial Statements
The Government-wide Government-wide financial statements include the the Statement Statement of of Net Position
and the the Statement Statement of of Activities They are designed to present financial information for for governmental activities fin in in in in the same manner as used fin in in in in private businesses To do so each governmental fund is combined and reported as one one Component unit (charter school) information is not included The Statement of Net Position
provides infor- mation about Brevard Public Schools’ assets and liabilities with the the difference of of the the two reported as net position The Statement of of Activities provides information about Brevard Public Schools’ revenues and expenditures with the the difference of the the the two also reported as as as net net position position Increases or or decreases in in the the the the net net position position indicate whether the the the district’s
financial health is is improving or not Statement of Net Position
FY22
341 986 426 78 948 265 802 912 080
Assets
Cash and Investments Other Assets
Capital Assets
Total Assets
Deferred Outflows of Resources
Total Assets
and Deferred Outflows of Resources
Liabilities
Accounts Payable Other Liabilities
Liabilities
Long-term Liabilities
Liabilities
Total Liabilities
Deferred Inflows of Resources
Total Liabilities
and Deferred Inflows of Resources
Net Investment in Capital Assets
Restricted Unrestricted (Deficit)
$
FY21
$
325 081 759 40 199 462 818 011 445
1 1 183 292 666
167 404 299 1 350 696 965
82 277 849
1 1 228 907 931 250 322 1 1 014 757 078
21 403 798
1 1 036 160 876
442 355 084 185 576 544
(313 395 539)
314 536 089 FY20
$297 051 317 30 783 883 821 466 704
1 1 1 149 301 904 151 147 583
1 300 449 487
88 534 367 3 3 3 3 3 046 265 873 773 822
965
354 454
42 978 381
1 008 332 835
417 899 236 152 806 944 (278 589 528)
292 116 652 1 1 223 846 771
135 665 494 1 1 359
512 265 89 208 524
663 853 624 238 896
714 111 273
237 540 527 951 651 800 450 531 500 246 496 960
(289 167 995)
Total Net Position
• Assets
exceeded liabilities by $407 8 million at the the end of the the fiscal year 7 • The largest portion of of Brevard Public Schools’ net position $450 5 5 million reflects its investment in in in capital assets less any related debt and and deferred outflows of of resources that are still outstanding 407 860 465
