
Page 9 - PFAR Report 2022
P. 9
Statement of Activites
Revenues
Charges for Services
Operating Grants Grants and and Contributions
Contributions
Capital Grants Grants and and Contributions
Contributions
Property Property Taxes Taxes Levied Levied for for General Purposes Property Property Taxes Taxes Levied Levied for for Capital Projects Local Sales Surtax
Grants and Contributions
Non-Restricted Miscellaneous
Unrestricted Investment Earnings
Sale of Assets
Transfers
Total Revenues
Expenses
Instructional Instructional Services
Instructional Instructional Support Services
Services
Services
Student Services
School School Board
General and School School Administration Non-Capitalizable Facilities Acquisition & Constr Fiscal Services
Services
Food Services
Services
Services
Central Services
Services
Student Transportation Services
Services
Operation and Maintenance of Plant Administrative Technology Services
Services
Community Services
Interest on on on Long-Term Debt
Depreciation - - Unallocated
Loss on on on Disposition of Assets
Total Expenses
Change in Net Position
Net Net Position
Position
Beginning Adjustment to Net Net Position
Position
Net Position
Beginning as Restated
Net Position
Ending
$
FY22
4 4 501 343 60 500 737 2 407 301 218 505 036 75 331 031 62 092 092 267 459 310 092 092 24 212 029 (754 486) 1 1 741 488 2 2 299 000
910 145 838
419 600 036 55 930 490 28 981 254
1 1 1 190 765 45 662 780 39 997 479
3 3 3 629 066 38
526 559 15 058 354 18 250 834 73 998 723
4 4 795 527 10 064 362 14 466 975 46 46 668 258
0 816 821 462 93 324 376
314 536 089 0 314 536 089 407 860 465
FY21
$
3 3 537 526 48 259 941 2 2 2 743 592 209 714 803 70 804 494 51 591 468 441 861 776 17 281 904 384 095 127 200 799 035
847 105 834 440 025 517 60 026 543 31 586 700
1 1 1 691 084 48 908 443 35 952 007
3 3 3 3 3 3 830 591 34 353 900 7 7 643 423 20 20 800 473 74 041 020 5 5 5 651 770 6 6 245 102 17 142 353 45 160 549 0 833 059 475 14 046 359
292 116 652 8 8 373 078
300 489 730
314 536 089 FY20
$
6 6 6 976 472 38
062 128 2 2 2 2 2 778 405 202 038 732 66 065 786 46 693 650 418 812 816 9 103 475 6 003 210 0 0 1 359
695
797 894 369
432 300 248 57 671 102 29 056 013
1 1 1 1 084 286 48 169 412 30 30 187 187 187 187 3 3 3 3 3 3 3 584 305 33 322 573 8 8 168 997 21 200 326 72 171 643 4 4 4 4 913 664 2 2 116 584 16 16 102 569 42 461 844 387 692
802 898 445
(5 004 076)
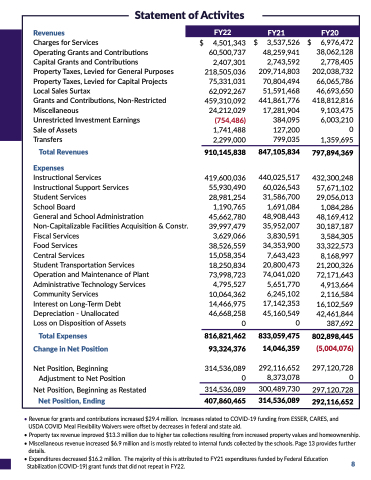
297 120 728 0 297 120 728 292 116 652 • Revenue for grants and and and contributions increased $29 4 million Increases related to COVID-19 funding from ESSER CARES and and and USDA COVID COVID Meal Flexibility Waivers were offset by decreases in in federal and and state aid • Property tax
tax
revenue improved $13 3 3 million due to higher tax
tax
collections resulting from increased property values and homeownership • Miscellaneous
revenue increased $6 9 million and is is mostly related to internal funds collected by the the schools Page 13
provides further details • Expenditures decreased $16 2 2 2 2 million The majority of this is is attributed to FY21
expenditures funded by Federal Education 8 Stabilization (COVID-19) grant funds that did not repeat in FY22
