
Page 1657 - draft
P. 1657
U.S. PUBLIC FINANCE
Appendix A: Using the Scorecard to Arrive at a Scorecard-Indicated Outcome
1. Measurement or Estimation of Factors in the Scorecard
In the “Discussion of the Scorecard Factors” section, we explain our analytical approach for scoring each
21
scorecard factor or sub-factor, and we describe why they are meaningful as credit indicators.
The information used in assessing the sub-factors is generally found in or calculated from information in the
school district’s financial statements, regulatory filings, derived from other observations or estimated by
Moody’s analysts. We may also incorporate non-public information.
Our ratings are forward-looking and reflect our expectations for future financial and operating performance.
However, historical results are helpful in understanding patterns and trends of a school district’s
performance as well as for peer comparisons. Financial ratios, unless otherwise indicated, are typically
calculated based on an annual or 12-month period. However, the factors in the scorecard can be assessed
using various time periods. For example, rating committees may find it analytically useful to examine both
historical and expected future performance for periods of several years or more.
Metrics that relate to pension and OPEB obligations are calculated based on our cross-sector methodology
22
that describes our adjustments to pension and OPEB data reported by GASB issuers. Financial metrics may
incorporate analytical adjustments that are specific to a particular school district.
2. Mapping Scorecard Factors to a Numeric Score
After estimating or calculating each factor or sub-factor, each outcome is mapped to a broad Moody’s
rating category (Aaa, Aa, A, Baa, Ba, B, Caa or Ca, also called alpha categories) and to a numeric score.
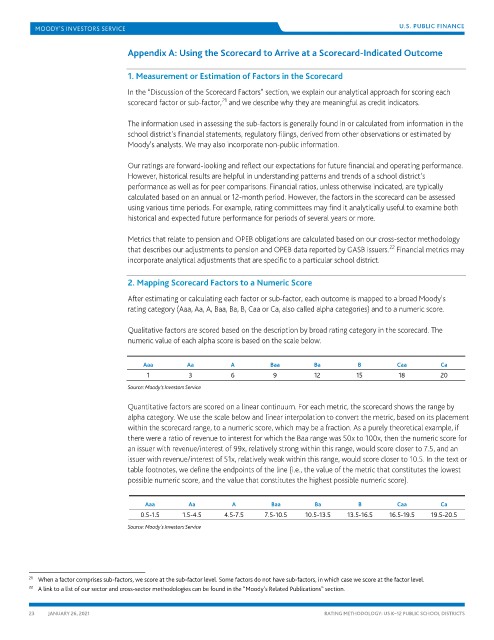
Qualitative factors are scored based on the description by broad rating category in the scorecard. The
numeric value of each alpha score is based on the scale below.
Aaa Aa A Baa Ba B Caa Ca
1 3 6 9 12 15 18 20
Source: Moody’s Investors Service
Quantitative factors are scored on a linear continuum. For each metric, the scorecard shows the range by
alpha category. We use the scale below and linear interpolation to convert the metric, based on its placement
within the scorecard range, to a numeric score, which may be a fraction. As a purely theoretical example, if
there were a ratio of revenue to interest for which the Baa range was 50x to 100x, then the numeric score for
an issuer with revenue/interest of 99x, relatively strong within this range, would score closer to 7.5, and an
issuer with revenue/interest of 51x, relatively weak within this range, would score closer to 10.5. In the text or
table footnotes, we define the endpoints of the line (i.e., the value of the metric that constitutes the lowest
possible numeric score, and the value that constitutes the highest possible numeric score).
Aaa Aa A Baa Ba B Caa Ca
0.5-1.5 1.5-4.5 4.5-7.5 7.5-10.5 10.5-13.5 13.5-16.5 16.5-19.5 19.5-20.5
Source: Moody’s Investors Service
21 When a factor comprises sub-factors, we score at the sub-factor level. Some factors do not have sub-factors, in which case we score at the factor level.
22 A link to a list of our sector and cross-sector methodologies can be found in the “Moody’s Related Publications” section.
23 JANUARY 26, 2021 RATING METHODOLOGY: US K–12 PUBLIC SCHOOL DISTRICTS