
Page 600 - Area X - G
P. 600
% t t a
2. Quality Graduates
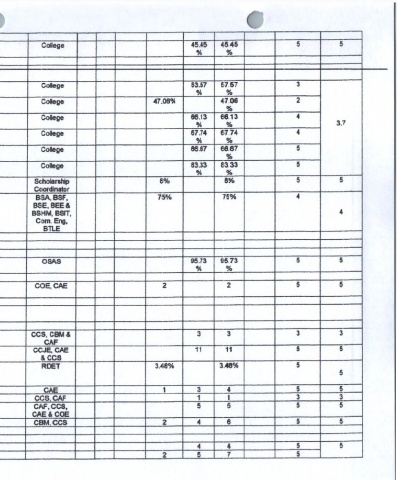
5 Percentage of graduates (2 years prior) that are 36 36% College 45.45 4545 5 5
employed % % %
3. Quality Faculty and Students
that pass the licensure exam,
ALE 70 70 College 53.57 57 57 3
% %
FLE 7° 70 College 47.06% 47 06 2
%
B LEPT-B SE 70 70 College 66.13 6613 4
% % 3.7
B LEPT-B EE 70 70 College 67.74 6774 4
% %
CUE 70 70 College 66.67 €667 5
%
Midv/ifery l.E *70 70 College 83.33 83 33 5
% %
—
7 Average % of scholars enrolled in the undergraduate 2.50 2.50% Scholarship 8% 8% 5 5
level % Coordinator
8 Percentage of undergraduate students population 86% 86% BSA, BSF, 75% 75% 4
enrolled In CHED identified and RDC-identified priority BSE, BEE &
courses programs BSHM, BSIT, 4
Com. Eng,
BTLE
4. Globally Com petitive Students
Percentage of students involved in inter country mobility
5. Quality Facilities and Services
9 Percentage of students who rated students services a3 90 90% OSAS 95.73 95 73 5 5
good or higher % % %
6. Ciflturally-SensBtive Graduates
10 No. of institutional subjects geared towards cultural 1 1 COE, CAE 2 2 5 5
heritage included in the course syllabus
Pomelo Prelect
B. GO.AL 2 - STRONG RESEARCH LEADERSHIP AND
CULTURE
1 .Strong research Brand and Image
11 Number of RD outputs in the ast 3 years utilized by the 5 5 CCS, CBM 4 3 3 3 3
industry or by the other benef ciaries CAF
12 No. of research outputs completed within the year 8 8 CCJE, CAE 11 11 5 5
& CCS
13 Percentage of research outputs published (such as 3% 3% RDET 3.48% 3.48% 5
Elsevier Scopus. Thomson Reuters Journals and CHED 5
accredited Journals}__
14 No. of externally funded researches 1 1 CAE 1 3 4 5 5
15 No. of interventions patented/copyrighted 2 2 CCS, CAF 1 1 3 3
16 No. of citations 5 5 CAF. CCS, 5 5 5 5
CAE & COE
17 No. of technology-based research outputs 3 3 CBM, CCS 2 4 6 5 5
18 No. of Researches presented
a. International
b. Nationa 2 2 4 4 5 5
c. Regional 2 2 2 5 7 5
IFSU-D PI M-PLN-F005-A