
Page 6 - RE/MAX Chay Brochure 2019
P. 6
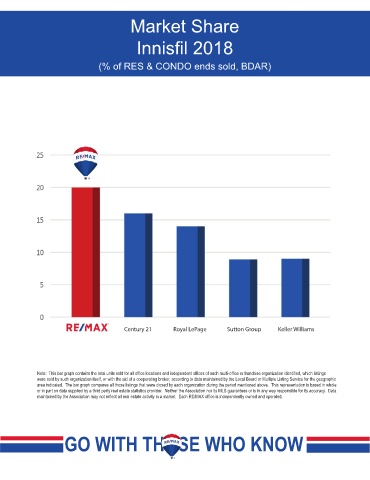
Market Share


                                              Innisfil 2018


                                  (% of RES & CONDO ends sold, BDAR)


                                          Century 21      Royal LePage      Sutton Group     Keller Williams


             Note:  This bar graph contains the total units sold for all office locations and independent offices of each multi-office or franchise organization identified, which listings
             were sold by such organization itself, or with the aid of a cooperating broker, according to data maintained by the Local Board or Multiple Listing Service for the geographic
             area indicated.  The bar graph compares all those listings that were closed by each organization during the period mentioned above.  This representation is based in whole
             or in part on data supplied by a third party real estate statistics provider.  Neither the Association nor its MLS guarantees or is in any way responsible for its accuracy.  Data
             maintained by the Association may not reflect all real estate activity in a market.  Each RE/MAX office is independently owned and operated.


                      GO WITH THOSE WHO KNOW