
Page 19 - CvSU Trece Campus Enrollment History
P. 19
A
V
IT
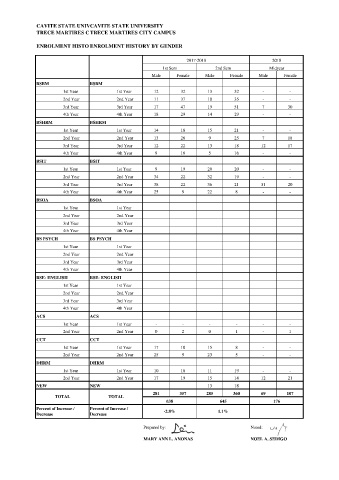
CAVITE STATE UNIVERSITYE STATE UNIVERSITY
C
M
T
R
A
C
R
TRECE MARTIRES CITY CAMPUSTIRES CITY CAMPUS
E
E
E
N
M
E
O
L
R
ENROLMENT HISTORY BY GENDERHISTORY BY GENDER
N
T
2017-2018 2018
1st Sem 2nd Sem Midyear
Male Female Male Female Male Female
BSBM BSBM
1st Year 1st Year 12 32 13 32 - -
2nd Year 2nd Year 11 37 10 35 - -
3rd Year 3rd Year 17 47 19 51 7 30
4th Year 4th Year 18 29 14 29 - -
BSHRM BSHRM
1st Year 1st Year 14 18 15 21 - -
2nd Year 2nd Year 13 26 9 25 7 18
3rd Year 3rd Year 12 22 13 18 12 17
4th Year 4th Year 9 16 5 16 - -
BSIT BSIT
1st Year 1st Year 9 19 20 20 - -
2nd Year 2nd Year 34 22 32 19 - -
3rd Year 3rd Year 38 22 36 21 31 20
4th Year 4th Year 25 9 22 8 - -
BSOA BSOA
1st Year 1st Year
2nd Year 2nd Year
3rd Year 3rd Year
4th Year 4th Year
BS PSYCH BS PSYCH
1st Year 1st Year
2nd Year 2nd Year
3rd Year 3rd Year
4th Year 4th Year
BSE- ENGLISH BSE- ENGLISH
1st Year 1st Year
2nd Year 2nd Year
3rd Year 3rd Year
4th Year 4th Year
ACS ACS
1st Year 1st Year - - - - - -
2nd Year 2nd Year 0 2 0 1 - 1
CCT CCT
1st Year 1st Year 17 10 15 8 - -
2nd Year 2nd Year 25 9 23 5 - -
DHRM DHRM
1st Year 1st Year 10 18 11 19 - -
2nd Year 2nd Year 17 19 15 14 12 21
NEW NEW 13 18
281 357 285 360 69 107
TOTAL TOTAL
638 645 176
Percent of Increase / Percent of Increase / -2.8% 1.1%
Decrease Decrease
Prepared by: Noted:
MARY ANN L. ANONAS NOEL A. SEDIGO