
Page 25 - QUEENSLANDTOUCHANNUALREPORT_Neat
P. 25
QT F A NNU A L R E P O R T
Financial Performance performance of the Association over the period a number
of tables, accompanied by explanatory notes, are
To further detail the current financial health and provided for consideration.
2014 2015 2016 2017
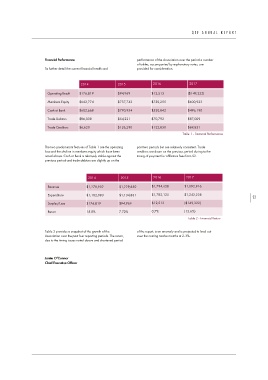
Operating Result $176,819 $94,969 $12,513 ($149,322)
Members Equity $642,774 $737,742 $750,255 $600,933
Cash at Bank $602,668 $790,954 $530,842 $496,190
Trade Debtors $86,038 $54,221 $70,792 $87,009
Trade Creditors $6,620 $126,290 $132,850 $69,831
Table 1 - Financial Performance
The two predominant features of Table 1 are the operating past two periods but are relatively consistent. Trade
loss and the decline in members equity which have been creditors are down on the previous period during to the
noted above. Cash at Bank is relatively stable against the timing of payment for affiliation fees from S2.
previous period and trade debtors are slightly up on the
2014 2015 2016 2017
Revenue $1,278,902 $1,229,850 $1,794,638 $1,092,916
Expenditure $1,102,083 $1,134,881 $1,782,125 $1,242,238 23
|
Surplus/Loss $176,819 $94,969 $12,513 ($149,322)
Return 15.8% 7.72% 0.7% (13.6%)
Table 2 - Financial Return
Table 2 provides a snapshot of the growth of the of the report, is an anomoly and is projected to level out
Association over the past four reporting periods. The return, over the coming twelve months at 2-3%.
due to the timing issues noted above and shortened period
Jamie O’Connor
Chief Executive Officer
Figure 3 – Key Expenditure