
Page 162 - Cambridge IGCSE Business Studies
P. 162
Cambridge IGCSE Business Studies Section 3 Marketing
■ When a survey involves an interview, the interviewer may ask questions in a way that
encourages the interviewee to give an answer that does not reflect their true view.
■ The language used by the interviewer, or used in a questionnaire, may be unclear or
difficult to understand.
■ The data may be recorded incorrectly, or numerical analysis carried out incorrectly.
■ Secondary data may be out-of-date.
■ Secondary data may have been collected for a different purpose to the one it is now
being used for.
Any of these factors can result in market research data being biased and inaccurate.
If this is the case, then using the data is likely to result in poor or incorrect
decisions being taken.
TEST YOURSELF
1 Explain how and why a manufacturer of ice-cream products should be ‘market-
orientated’.
2 Using examples explain the difference between qualitative market research
methods and quantitative market research methods.
3 Identify and explain three reasons why the results of market research
may not be useful.
Presentation and use of market
160 research results
Once the market research has been carried out, the results need to be presented
and analysed.
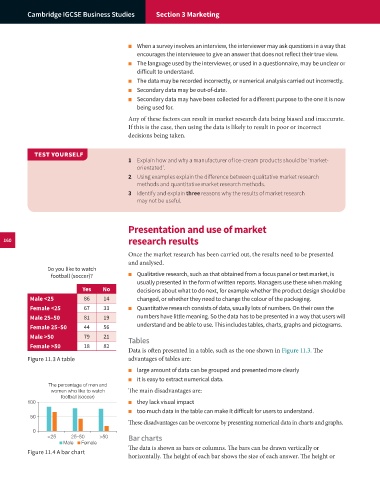
Do you like to watch
football (soccer)? ■ Qualitative research, such as that obtained from a focus panel or test market, is
usually presented in the form of written reports. Managers use these when making
Yes No decisions about what to do next, for example whether the product design should be
Male <25 86 14 changed, or whether they need to change the colour of the packaging.
Female <25 67 33 ■ Quantitative research consists of data, usually lots of numbers. On their own the
Male 25–50 81 19 numbers have little meaning. So the data has to be presented in a way that users will
understand and be able to use. This includes tables, charts, graphs and pictograms.
Female 25–50 44 56
Male >50 79 21
Tables
Female >50 18 82
Data is often presented in a table, such as the one shown in Figure 11.3. Th e
Figure 11.3 A table advantages of tables are:
■ large amount of data can be grouped and presented more clearly
■ it is easy to extract numerical data.
The percentage of men and
women who like to watch The main disadvantages are:
football (soccer)
100 ■ they lack visual impact
■ too much data in the table can make it difficult for users to understand.
50
These disadvantages can be overcome by presenting numerical data in charts and graphs.
0
<25 25–50 >50 Bar charts
Male Female
The data is shown as bars or columns. The bars can be drawn vertically or
Figure 11.4 A bar chart
horizontally. The height of each bar shows the size of each answer. The height or