
Page 219 - Cambridge IGCSE Business Studies
P. 219
16: Costs, scale of production and break-even analysis
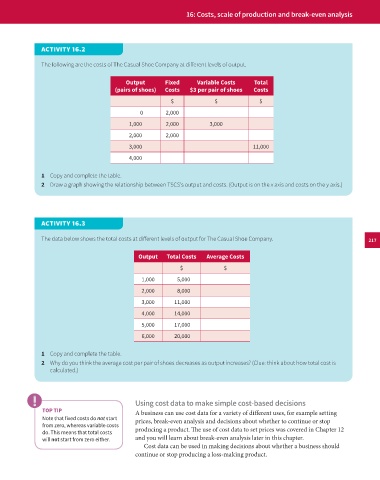
ACTIVITY 16.2
The following are the costs of The Casual Shoe Company at different levels of output.
Output Fixed Variable Costs Total
(pairs of shoes) Costs $3 per pair of shoes Costs
$ $ $
0 2,000
1,000 2,000 3,000
2,000 2,000
3,000 11,000
4,000
1 Copy and complete the table.
2 Draw a graph showing the relationship between TSCS’s output and costs. (Output is on the x axis and costs on the y axis.)
ACTIVITY 16.3
The data below shows the total costs at different levels of output for The Casual Shoe Company. 217
Output Total Costs Average Costs
$ $
1,000 5,000
2,000 8,000
3,000 11,000
4,000 14,000
5,000 17,000
6,000 20,000
1 Copy and complete the table.
2 Why do you think the average cost per pair of shoes decreases as output increases? (Clue: think about how total cost is
calculated.)
Using cost data to make simple cost-based decisions
TOP TIP
A business can use cost data for a variety of different uses, for example setting
Note that fixed costs do not start prices, break-even analysis and decisions about whether to continue or stop
from zero, whereas variable costs
producing a product. The use of cost data to set prices was covered in Chapter 12
do. This means that total costs
will not start from zero either. and you will learn about break-even analysis later in this chapter.
Cost data can be used in making decisions about whether a business should
continue or stop producing a loss-making product.