
Page 226 - Cambridge IGCSE Business Studies
P. 226
Cambridge IGCSE Business Studies Section 4 Operations management
Cost/Revenue
Revenue
Total cost
Break-even point
Notice that total cost
Area of profit
and fixed cost
do NOT start at zero
Fixed cost
Output
Area of loss
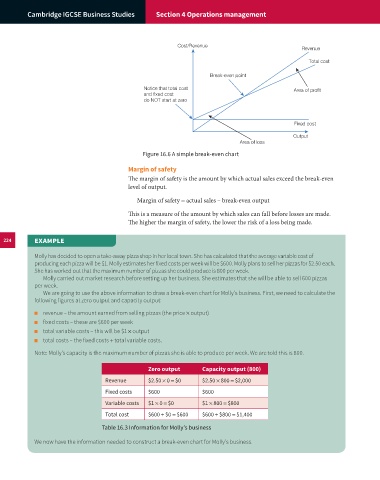
Figure 16.6 A simple break-even chart
Margin of safety
The margin of safety is the amount by which actual sales exceed the break-even
level of output.
Margin of safety = actual sales – break-even output
This is a measure of the amount by which sales can fall before losses are made.
The higher the margin of safety, the lower the risk of a loss being made.
224 EXAMPLE
Molly has decided to open a take-away pizza shop in her local town. She has calculated that the average variable cost of
producing each pizza will be $1. Molly estimates her fixed costs per week will be $600. Molly plans to sell her pizzas for $2.50 each.
She has worked out that the maximum number of pizzas she could produce is 800 per week.
Molly carried out market research before setting up her business. She estimates that she will be able to sell 600 pizzas
per week.
We are going to use the above information to draw a break-even chart for Molly’s business. First, we need to calculate the
following figures at zero output and capacity output:
■ revenue – the amount earned from selling pizzas (the price × output)
■ fixed costs – these are $600 per week
■ total variable costs – this will be $1 × output
■ total costs – the fixed costs + total variable costs.
Note: Molly’s capacity is the maximum number of pizzas she is able to produce per week. We are told this is 800.
Zero output Capacity output (800)
Revenue $2.50 × 0 = $0 $2.50 × 800 = $2,000
Fixed costs $600 $600
Variable costs $1 × 0 = $0 $1 × 800 = $800
Total cost $600 + $0 = $600 $600 + $800 = $1,400
Table 16.3 Information for Molly’s business
We now have the information needed to construct a break-even chart for Molly’s business.