
Page 104 - Loomis Annual Report 2017
P. 104
100 Notes – Group
Loomis Annual Report 2017
Note 30 cont.
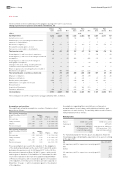
The movement in the net de ned bene t obligation during 2015–2017 is as follows:
Change in provisions for pensions and similar commitments, net
Obliga- Plan tions assets
Net
Obliga- Plan tions assets
2016
3,125 –2,464
56 –
7 – 70 –62 3 – –10 5
127 –57
51 –
Obliga- Plan
Net tions assets Net
2015
661 3,087 –2,371 717
56 60 60
7 7 – 7 8 81 –70 12 3 – – –
–5 – – –
70 148 –70 78
51 –38 – –38 468 –30 – –30 –30 –40 – –40 –22 – 5 5
–227 – 44 44
240 –107 49 –58
–89 – –92 –92 – 25 –25 – – –161 161 – – –7 7 – – – – –
–110 – – – 14 140 –123 17
786 3,125 –2,464 661
2017
3,214
–2,428
786
51
–
51
6
–
6
60
–51
9
1
–
1
0
–
0
118
–51
67
–2
–
–2
60
–
60
0
–
0
–
12
12
–
–91
–91
58
–78
–20
–
–79
–79
20
–20
–
–153
153
–
–6
6
–
–
–
–
–
–
–
–56
50
–5
3,193
–2,445
748
SEK m
Opening balance
Current service costs
Administration costs (excluding investment related expenses for funded plans)
Net interest cost/gain (–)
Recognized actuarial gains (–)/losses
Past service costs/credits (–) & settlements Total pension costs
Actuarial gains (–) and losses due to experience
Actuarial gains (–) and losses from changes in nancial
assumptions 468
Actuarial gains (–) and losses from changes in
demographic assumptions –30
Changes in the asset ceiling, excluding amounts
included in interest expense/interest income –
Return on plan assets, excluding amounts included in
Net interest cost / gain (–) –
Total actuarial gains (–) and losses before tax 490
–
– –22 –227
–249
Employer contributions –
Employee contributions 24
Bene ts paid to participants –148 Administration costs paid over the year –7 Reclassi cations – Acquisitions/Divestments –274
Translation differences –123 137
Closing balance 3,214 –2,428
The contribution for 2018 is expected to be approximately SEK –82 million.
–89 –24 148
7
– 164
Assumptions and sensitives
The signi cant actuarial assumptions used as of balance sheet day were as follows:
Assumptions regarding future mortality are set based on actuarial advice in accordance with published statistics and experience in each territory. The mortality tables used in France, Switzerland and UK as follows:
UK
Switzer- land
France
Other
2.50
0.50–0.65
1.20–1.30
1.70–1.90
n/a
1.00
2.30
1.80–2.50
2.40–3.40
0.75
1.20
0.00–1.50
3.30
0.00
n/a
0.00–1.50
Main actuarial assumptions as per December 31, 2017 (%)
Discount rate Salary increases In ation
Pension increases
Main actuarial assumptions
as per December 31, 2016 Switzer- (%) UK land
Discount rate 2.70 0.45–0.60 Salary increases n/a 1.00 In ation 2.45–3.45 0.75 Pension increases 3.35 0.00
Mortality tables
France Switzerland UK
2016
INSEE 2012–2014 LPP 2015
Club Vita 2014, CMI Core 2015 projections, 1.0% long term improvement
rate
2017
INSEE 2013–2015
LPP 2015
Club Vita 2014, CMI Core 2015 projections, 1.0% long term improvement
rate
France Other
1.30 1.50–2.00 2.30 1.80–2.25 2.00 0.00–1.50
n/a 0.00–1.50
For Switzerland and the UK, the above assumptions mean the following average remaining life expectancy for a person retiring at the age of 65:
UK
Life expectancy at 65 for a pensioner currently aged 65: Men
Women
Life expectancy at 65 for a pensioner currently aged 45: Men
Women
Dec. 31, 2017
20.9
23.4
22.4
25.6
These assumptions are used in the valuation of the obligations of the de ned bene t plans at the end of 2017 and 2016 and to determine the pension costs for 2018 and 2017. In the UK, the discount rate is based on iBoxx UK AA 15 years + with consid- eration given to duration of the liabilities. In Switzerland, the dis- count rate is based on discount rates published by Chamber of Pensions Actuaries, with consideration given to the duration of the liabilities. In the Eurozone, the discount rate is based on iBoxx Euro 10 years +, with consideration given to the duration of the liabilities.
