
Page 105 - Loomis Annual Report 2017
P. 105
Loomis Annual Report 2017
Notes – Group 101
Dec. 31, 2017
–56
56
27
–28
51
Dec. 31, 2017
22.2
24.1
22.8
24.6
Swiztzerland
Life expectancy at 65 for a pensioner currently aged 65: Men
Women
Life expectancy at 65 for a pensioner currently aged 45: Men
Women
No average life expectancy in years are given for France as this is not a key assumption due to the nature of the plan (lump sum arrangement).
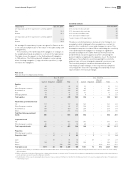
The sensitivity of the de ned bene t obligation to changes in the weighted principal assumptions is shown in the table below. The table shows the impact on the De ned bene t obligation
in SEK millions. The De ned bene t obligation is decreasing when showing a negative (–) sign, whereas a positive (+) sign increases the obligation.
Plan assets
Plan assets are comprised as follows:
Equities
UK
Other European countries North America
Asia
Emerging markets
Total equities
Fixed index government bonds
Sensitivity analysis
SEK m
0.1% increase in discount rate 0.1% decrease in discount rate 0.1% increase in in ation rate 0.1% decrease in in ation rate
1 year increase in life expectancy
The above sensitivity analyses are based on a change in one assumption while holding all other assumptions constant. In practice, this is unlikely to occur, and changes in some of the assumptions may be correlated. When calculating the sensitivity of the de ned bene t obligation to changes in signi cant actuarial assumptions the same method, the Projected Unit Credit method, has been applied as when calculating the pension liability recognized in the balance sheet. The method and types of assumptions used in preparing the sensitivity analysis have not been changed compared to previous year. The sensitivity analysis has been determined based on reasonably possible changes of the respective assumptions occurring at the end of the reporting period and may not be representative of the actual change.
Dec. 31, 2016
Info. not
Quoted Unquoted available Total %
Dec. 31, 2017
Info. not
Quoted Unquoted available Total %
86 – – 86 3.5
110 – – 110 4.5
158 – – 158 6.5
81 – – 81 3.3
36 – – 36 1.5
470 – – 470 19.2
157 – – 157 6.4
66 – – 66 2.7
189 – – 189 7.7
274 – – 274 11.2
686 – – 686 28.0
415 – – 415 17.0
48 – – 48 1.9
462 – – 462 18.9
– 6 – 6 0.2
– 6 – 6 0.2
– 38 – 38 1.6
194 – – 194 7.9
– – 590 590 24.1
1,811 44 590 2,445 100
UK 165
Other European countries
North America
Other
106 204 219
23
85 167 71 8
354
– – 23 1.0 – – 85 3.5 – – 167 6.9 – – 71 2.9 – – 8 0.3
– – 354 14.6 – – 165 6.8
– – 106 4.4 – – 204 8.4 – – 219 9.0
– – 694 28.6 – – 341 14.1
– – 49 2.0
– – 390 16.1 5 – 5 0.2
5 – 5 0.2 67 – 67 2.8
– – 304 12.5 – 6123) 612 25.2
72 612 2,428 100.0
Total xed index government
bonds 694
Corporate bonds
UK 341
Other European countries
Total corporate bonds
Properties
Other European countries
Properties, total
Cash
Other1)
Other2) –
Total plan assets 1,743
49
390
–
–
– 304
1) This item consists mainly of investments in Russell Investments Multi-Asset Growth Strategy Fund (MAGS), a multi-strategy fund that invests in various classes of assets in many different markets.
2) Refers to the assets in the three Swiss pension schemes where insurance contracts exists. The assets in these plans are managed by an external party and the return that these assets generates are used to pay the employees’ bene ts.
3) The distribution of these assets, geographically or by asset class, as well as information on whether the holding was listed or not, was not available at the date of the publication of this Annual report.
