
Page 68 - Loomis Annual Report 2017
P. 68
64 Financial statements – Group
Loomis Annual Report 2017
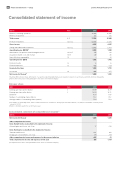
Consolidated statement of income
Revenue, continuing operations Revenue, acquisitions
Total revenue
Production expenses
Gross income
Selling and administrative expenses
Operating income (EBITA)1)
Amortization of acquisition-related intangible assets Acquisition-related costs and revenue
Items affecting comparability
Operating income (EBIT)
Financial income Financial expenses
Income before taxes
Income tax
Net income for the year2)
1) Earnings Before Interest, Taxes, Amortization of acquisition-related intangible xed assets, Acquisition-related costs and revenue and Items affecting comparability. 2) Net income for the year is entirely attributable to the owners of the Parent Company.
16,485 315 16,800
SEK m
Note
2017
16,824
404
2016
17,228
–12,533
4,695
–2,602
2,093
–55
–47
1,882
–
1,992
13
–122
–454
1,428
SEK
SEK m
8, 9
10,11,12 –12,493
4,307
10,11,12 –2,417
1,890
10,12,17 –62 10,15 –56 10 81
1,852
13 12 13 –129
1,735
14 –477
Data per share
Earnings per share, before dilution
Earnings per share, after dilution
Dividend4)
Number of outstanding shares (million) Average number of outstanding shares (million)
1,258
3
3 16.73
3) The number of outstanding shares, which constitutes the basis for calculation of earnings per share before dilution, is 75,226,032. The number of treasury shares amount to 53,797.
4) Refers to dividends paid in the current nancial year.
Consolidated statement of comprehensive income5)
Note
2017
18.993)
18.99
8.00
75.2
75.23)
2016
16.733)
7.00 75.2 75.23)
2017
Net income for the year 1,258
Other comprehensive income
Items that will not be reclassi ed to the statement of income
Actuarial gains and losses, net of tax –183
Items that may be reclassi ed to the statement of income
Translation differences 402 Hedging of net investments, net of tax –159 Other comprehensive income and expenses for the year, net after tax 61 Total comprehensive income and expenses for the year 1,319
5) Comprehensive income is entirely attributable to the owners of the Parent Company.
1,428
2016
17
–631
179
–435
993
