
Page 86 - Loomis Annual Report 2017
P. 86
82
Notes – Group
Loomis Annual Report 2017
Note 6 cont.
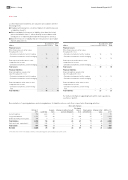
Loomis’ nancial instruments are valued in accordance with the following levels:
Unadjusted listed prices on active markets for identical assets
or liabilities (level 1)
Observed data for the asset or liability other than the listed
prices included in level 1, either directly in accordance with
listed prices or indirectly derived from listed prices (level 2) Data for the asset or liability that are not based on observable
market data (level 3)
SEK m
Financial assets
Other nancial assets at fair value through pro t or loss
– Derivative instruments held for trading
– Derivative instruments used for hedging
Financial assets at fair value in other comprehensive income
– Derivative instruments used for hedging
Total assets Financial liabilities
Financial liabilities valued at fair value through pro t or loss
– Derivative instruments held for trading
– Derivative instruments used for hedging
Financial liabilities at fair value in other comprehensive income
– Derivative instruments used for hedg- ing1)
Total liabilities
December 31, 2017
December 31, 2016 Level 1 Level 2 Level 3 Total
Level 1 Level 2 Level 3
Total
SEK m
Financial assets
Other nancial assets at fair value through pro t or loss
– Derivative instruments held for trading
– Derivative instruments used for hedging
Financial assets at fair value in other comprehensive income
– Derivative instruments used for hedging
Total assets Financial liabilities
Financial liabilities valued at fair value through pro t or loss
– Derivative instruments held for trading
– Derivative instruments used for hedging
Financial liabilities at fair value in other comprehensive income
– Derivative instruments used for hedg- ing1)
Total liabilities
-
16
-
16
-
30
-
30
-
-
-
-
-
46
-
46
-
3
-
3
-
-
-
-
-
11
-
11
-
14
-
14
– 16 – 14
– –
– 30
– 12 ––––
– 11 – 11
– 23 – 23
– 16 – 14
– –
– 30
Reconciliation of opening balance and closing balance for liabilities whose cash ow is reported in nancing activities:
For further information regarding funds within cash operations, see Note 2 and 23.
Non-cash changes
– 12
Current liabilities
Long-term liabilities
De ned bene t pension plans Total liabilies
Cash and cash equivalents1) Total assets
Net debt
-78 62
OB Jan 1, 2017
Cash ow
Acquisi- tions
Change in de ned bene t pension obligation
-33
Exchange rate ef- fects
-97
New leasing commitments
71
Change in fair value
-31
CB Dec 31, 2017
754
3,173
799
4,726
-797
-797
-663 -18 0 3 25 -26 777 80 0 -100 47 3 00 -33000
-192 0 0 0 0 -8
3,979
4,820
75
766
114 62 -33 -97 71 -23
-192 0 0 0 0 -8
-997
-997
3,929
3,823
1) The line does not tie to the balance sheet as it includes trapped cash and nancial current assets.
