
Page 36 - LDC FlipBook demo
P. 36
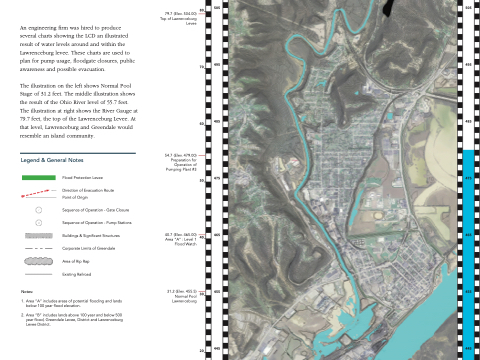
An engineering firm was hired to produce several charts showing the LCD an illustrated result of water levels around and within the Lawrenceburg levee. These charts are used to plan for pump usage, floodgate closures, public awareness and possible evacuation.
The illustration on the left shows Normal Pool Stage of 31.2 feet. The middle illustration shows the result of the Ohio River level of 55.7 feet. The illustration at right shows the River Gauge at 79.7 feet, the top of the Lawrenceburg Levee. At that level, Lawrenceburg and Greendale would resemble an island community.
Legend & General Notes
79.7 (Elev. 504.00) Top of Lawrenceburg Levee
 Flood Protection Levee
Direction of Evacuation Route Point of Origin
Sequence of Operation - Gate Closure
Sequence of Operation - Pump Stations
Buildings & Significant Structures
Corporate Limits of Greendale
Area of Rip Rap
Existing Railroad
40.7 (Elev. 465.00) Area “A” : Level 1 Flood Watch
31.2 (Elev. 455.5) Normal Pool Lawrenceburg
54.7 (Elev. 479.00) Preparation for Operation of Pumping Plant #3
    Notes:
1. Area “A” includes areas of potential flooding and lands below 100 year flood elevation.
2. Area “B” includes lands above 100 year and below 500 year flood, Greendale Levee, District and Lawrenceburg Levee District.
