
Page 92 - GFS2019 Semster I
P. 92
1
0.0
0.0
0.0
0.0
0.0
0.0
0.0
0.0
0.0
0.0
0.0
0.0
0.0
0.0
0.0
0.0
0.0
0.0
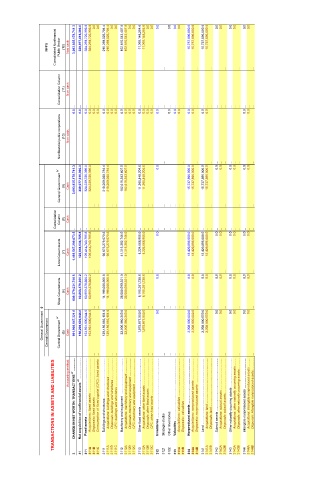
NFPS Consolidated Nonfinancial Public Sector (12) Non cash 3,093,835,178,741.3 339,977,616,396.0 324,239,720,396.0 324,239,720,396.0 210,259,028,784.4 210,259,028,784.4 102,615,543,407.0 102,615,543,407.0 11,365,148,204.6 11,365,148,204.6 15,737,896,000.0 15,737,896,000.0 15,737,896,000.0 15,737,896,000.0
... ... ... ... ... ... ...
Consolidation Column (11) Non cash
... ... ... ... ... ... ... ... ... ... ... ... ... ... ... ... ... ... ... ... ... ... ... ... ... ... ... ... ... ... ... ... ... ... ... ... ... ... ...
0.0 0.0 0.0 0.0 0.0 0.0 0.0 0.0 0.0 0.0 0.0 0.0 0.0 0.0 0.0 0.0 0.0 0.0 0.0 0.0 0.0 0.0 0.0 0.0 0.0 0.0 0.0 0.0
Nonfinancial public corporations (10) Non cash
... ... ... ... ... ... ... ... ... ... ...
b/ 3,093,835,178,741.3 339,977,616,396.0 324,239,720,396.0 324,239,720,396.0 210,259,028,784.4 210,259,028,784.4 102,615,543,407.0 102,615,543,407.0 11,365,148,204.6 11,365,148,204.6 0.0 15,737,896,000.0 15,737,896,000.0 15,737,896,000.0 15,737,896,000.0 0.0 0.0 0.0 0.0 0.0 0.0
General Government (9) Cash
... ... ... ... ... ... ... ... ... ... ... ... ... ... ... ... ... ...
Consolidation Column (8) Cash ... ... ... ... ... ... ... ... ... ... ... ... ... ... ... ... ... ... 0.0 ... ... ... ... ... ... ... ... ... ... ... ... 0.0 ... 0.0 ... ... 0.0 ... 0.0 ... ... 0.0 ... 0.0 ... 7/29/2019 2:54 PM
Local Governments (7) Cash 1,492,547,299,673.5 122,844,636,785.8 109,414,740,785.8 109,414,740,785.8 66,875,279,073.8 66,875,279,073.8 41,315,392,746.0 41,315,392,746.0 1,224,068,966.0 1,224,068,966.0 13,429,896,000.0 13,429,896,000.0 13,429,896,000.0 13,429,896,000.0
Net acquisition of nonfinancial assets d/ .................................................................................................................................................
... ... ... ... ... ... ... ... 0.0 ... ... ... ... ... 0.0 0.0 ... 0.0 0.0 ... 0.0 0.0 ... 0.0 0.0 ... 0.0 ...
Fixed assets .....................................................................................................................................................................
State Governments (6) Cash 609,379,031,746.8 60,863,378,666.2 60,863,378,666.2 60,863,378,666.2 ................................................................................................................................................................... 14,198,086,606.6 14,198,086,606.6 38,500,090,321.0 38,500,090,321.0 8,165,201,738.6 8,165,201,738.6 ....................................................... ................................
CHANGE IN NET WORTH: TRANSACTIONS c/ ......................................................................................................
0 ... ... ... ... ... ... ... ... 0.0 ... ... ... ... ................................................................................................................................................................... ................................................................................................................................................................... ... ... 0.0 0.0 ... 0.0 0.0 ... 0.0 0.0 ...
General Government Central Government a/ Central Government (5) Cash 991,908,847,321.0 156,269,600,944.0 153,961,600,944.0 ................................................................................................................................................................... 153,961,600,944.0 ...........................................................................................................................................................
... ... Buildings and structures ......................................................................................... ... ... Machinery and equipment ......................................................................................... ... ... Other fixed assets ................................................................................................. ... ... CFC: other fixed assets ......................................
Accounting method:
TRANSACTIONS IN ASSETS AND LIABILITIES Acquisitions: fixed assets Disposals: fixed assets Consumption of fixed capital (CFC): fixed assets Strategic stocks Other Inventories Acquisitions: valuables Disposals: valuables Acquisitions: nonproduced assets Disposals: nonproduced assets
3 31 311 311A 311B 311C 3111 3111A 3111B 3111C 3112 3112A 3112B 3112C 3113 3113A 3113B 3113C 312 3121 3122 313 313A 313B 314 314A 314B 3141 3141A 3141B 3142 3142A 3142B 3143 3143A 3143B 3144 3144A 3144B