
Page 24 - Book_Wec 06-09-SINGLES-Hi-Res
P. 24
evoluTIon of Power SecTor around 1900 kWh per year by 2030, increasing at a compound annual
growth rate (CAGr) of around 4.3% per annum which is currently at
1181 kWh.
India is the third largest primary energy consumer in the world and
accounted for 5.8% of the global primary energy consumption in 2018.
As per BP Statistical review 2019, India accounts for 12% of the global
coal consumption. The country experienced a large increase in oil
consumption, increasing by 0.3 Mb/d in 2018. renewable energy grew
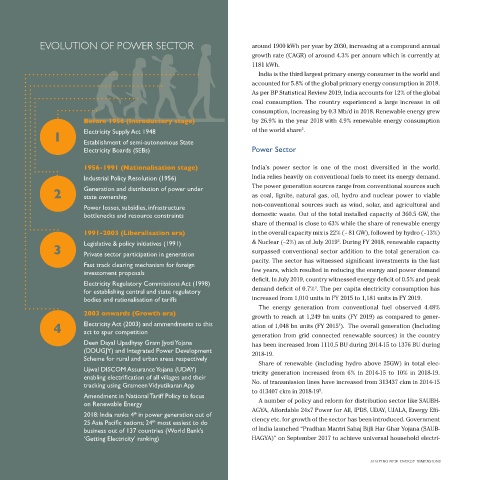
Before 1956 (introductory stage) by 26.9% in the year 2018 with 4.9% renewable energy consumption
2
electricity Supply Act 1948 of the world share .
1 establishment of semi-autonomous State
Electricity Boards (SEBs) Power Sector
1956-1991 (Nationalisation stage) India’s power sector is one of the most diversified in the world.
Industrial Policy Resolution (1956) India relies heavily on conventional fuels to meet its energy demand.
Generation and distribution of power under The power generation sources range from conventional sources such
2 state ownership as coal, lignite, natural gas, oil, hydro and nuclear power to viable
Power losses, subsidies, infrastructure non-conventional sources such as wind, solar, and agricultural and
bottlenecks and resource constraints domestic waste. Out of the total installed capacity of 360.5 GW, the
share of thermal is close to 63% while the share of renewable energy
1991-2003 (liberalisation era) in the overall capacity mix is 22% (~ 81 GW), followed by hydro (~13%)
2
Legislative & policy initiatives (1991) & nuclear (~2%) as of July 2019 . During Fy 2018, renewable capacity
3 Private sector participation in generation surpassed conventional sector addition to the total generation ca-
pacity. The sector has witnessed significant investments in the last
Fast track clearing mechanism for foreign
investoment proposals few years, which resulted in reducing the energy and power demand
deficit. In July 2019, country witnessed energy deficit of 0.5% and peak
Electricity Regulatory Commissions Act (1998) 3
for establishing central and state regulatory demand deficit of 0.7% . The per capita electricity consumption has
bodies and rationalisation of tariffs increased from 1,010 units in Fy 2015 to 1,181 units in Fy 2019.
The energy generation from conventional fuel observed 4.48%
2003 onwards (Growth era)
growth to reach at 1,249 bn units (Fy 2019) as compared to gener-
4 Electricity Act (2003) and ammendments to this ation of 1,048 bn units (Fy 2015 ). The overall generation (Including
4
act to spur competition
generation from grid connected renewable sources) in the country
Deen Dayal Upadhyay Gram Jyoti Yojana has been increased from 1110.5 BU during 2014-15 to 1376 BU during
(DDUGJY) and Integrated Power Development 2018-19.
Scheme for rural and urban areas respectively
Share of renewable (including hydro above 25GW) in total elec-
Ujwal DISCOM Assurance Yojana (UDAY) tricity generation increased from 6% in 2014-15 to 10% in 2018-19.
enabling electrification of all villages and their
tracking using Grameen vidyutikaran App no. of transmission lines have increased from 313437 ckm in 2014-15
5
to 413407 ckm in 2018-19 .
Amendment in National tariff Policy to focus
on renewable energy A number of policy and reform for distribution sector like SAUBH-
AGyA, Affordable 24x7 Power for All, IPDS, UDAy, UJALA, Energy Effi-
2018: india ranks 4 in power generation out of
th
25 Asia Pacific nations; 24 most easiest to do ciency etc. for growth of the sector has been introduced. Government
th
business out of 137 countries (World Bank’s of India launched “Pradhan Mantri Sahaj Bijli Har Ghar yojana (SAUB-
‘Getting Electricity’ ranking) HAGyA)” on September 2017 to achieve universal household electri-
10 shaping new energy dimensions