
Page 35 - Book_Wec 06-09-SPREADS-Low-Res
P. 35
2018-19
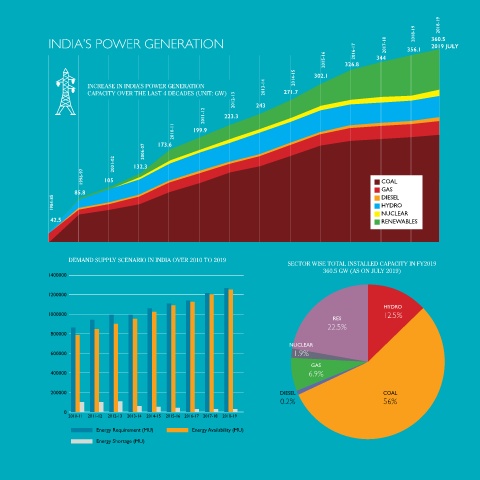
IndIa’s Power GeneratIon 2018-19 360.5
ndIa’s power generation sector has witnessed growth over the ects. The top five states with the highest installed generation capacity 2017-18 356.1 2019 July
last three decades owing to sustained economic growth thereby are Maharashtra, Gujarat, Tamil nadu, Karnataka and Uttar Pradesh. 2016-17 344
Idriving electricity demand. The Government of India’s focus on Regulatory reforms have upgraded the power sector and today many 2015-16 326.8
attaining ‘Power for all’, reforms such as generation de-licensing and states in India are having the well-strengthened power sector. 2014-15 302.1
other policy measures such as 100% FdI has accelerated capacity ad- Growth rate in power capacity has doubled from 4.2% over 1992 InCREasE In IndIa’s POWER GEnERaTIOn 2013-14
dition in the country. India has witnessed a declining power deficit to 2002 to 8.7% over 2012 to 2019. More than 1 Lakh MW generation CaPaCITY OvER THE LasT 4 dECadEs (UnIT: GW) 271.7
over the last decade, which currently stands at 0.7%. capacity has been added in last five years i.e. 243 GW in March 2014 to 2012-13 243
th
th
Currently, India is 4 largest consumer of electricity and 5 largest 360.5 GW in July 2019 . Today, India emerges as net exporter of elec-
5
in terms of installed capacity in the world, with the installed pow- tricity first time in FY 2017-18. 7203 MU supplied to nepal, Bangladesh 2011-12 223.3
er capacity reaching 360.5 GW as of July 2019 . Out of the total in- and Myanmar in FY 2017-18 and 4628 MU in 2018-19 (Up to October 2010-11 199.9
1
stalled capacity, the share of private sector is 46% followed by state 2018). nTPC, the leader in thermal power generation, with 55,786 MW 173.6
(29%) and central (26%). India generated around 1376 bn units of of installed capacity contributes 23% of total power generation & 16% 2006-07
2
electricity in financial year 2018-19, up 5.19% from the previous year . of total installed capacity in the country. nHPC a hydro power major
The country is behind only China and Us and is ahead of Russia, has a total installed capacity of 7071 MW. 2001-02 132.3
Japan, Germany, and Canada. The Overall generation (Including gen- 1996-97 105 Coal
eration from grid connected renewable sources & Bhutan imports) Demand-Supply Scenario GaS
in the country has been increased from 1110 BU during 2014-15 to 85.8 DieSel
1376 BU during 2018-19. The performance of category wise generation all India per capita consumption of electricity has grown from 631 1984-85 HyDro
during the year 2018-19 was as follows: kWh (FY 2005-06) to 1181 kWh (FY 2018-19) . Energy deficit has re- nuClear
6
42.5
7
• Thermal Increased by 3.39% duced from 4.2% (in FY 2013-14) to 0.5% (in July 2019) . India’s power reneWableS
• Hydro Reduced by 6.95% system needs to almost triple in size by 2040 to catch up and keep
• nuclear Increased by 1.39% pace with electricity demand that – boosted by rising incomes and
• Bhutan Import Increased by 7.78% new connections to the grid – increases at almost 5% per year. Going
8
• Renewables Increased by 24.47% forward, healthy demand growth rates would translate into greater dEMand sUPPLY sCEnaRIO In IndIa OvER 2010 TO 2019
sECTOR WIsE TOTaL InsTaLLEd CaPaCITY In FY2019
Between april 2000 and March 2019, the power sector attracted need for power capacity. Commensurate with our country’s growth 360.5 GW (as On JULY 2019)
1400000
Usd 14.32 bn in FdI, accounting for 3.41 per cent of total FdI inflows in challenges, nTPC has embarked upon an ambitious plan to attain a
3
India . India’s power sector is forecasted to attract investments worth total installed capacity of 130 GW by 2030.
1200000
4
InR 9-9.5 trillion (Usd 128.24-135.37 bn) between FY19-23 . The total
FdI inflows in the power sector reached Usd 14.32 bn during apr 2000 Policy impetus HyDro
to March 2019, accounting for 3.48% of total FdI inflows in India. as 1000000 reS 12.5%
per economic survey 2018-2019, additional investments in renewable • Power sector in India witnessed a major structural reform in 22.5%
plants up to year 2022 would be about Usd 80 bn and an investment 2003, when generation was de-licensed under the Electricity 800000
of around Usd 250 bn for the period 2023-2030. act 2003. nuClear
• simultaneously, establishment of independent regulators, 600000 1.9%
Where we stand energy exchanges for power trading and unbundling of ver- GaS
tically integrated power entities provided the necessary im- 400000 6.9%
In January 2014, India turned into a one nation, one grid turning the petus for growth.
country into one seamless network for delivering electricity to con- • development of a synchronously operating national Grid 200000 DieSel Coal
sumers. Further, the Government has introduced policy and regulato- leading to ‘One nation One Grid One Frequency’, which en- 0.2% 56%
ry interventions like signing of new fuel supply agreements (Fsas) by abled development of a vibrant electricity market in India 0
Coal India Limited (CIL), allocation of new captive coal blocks by the and optimisation of resources. 2010-11 2011-12 2012-13 2013-14 2014-15 2015-16 2016-17 2017-18 2018-19
Ministry of Coal (MoC), finalization of revised standard bidding doc- • determination of tariff based on competitive bidding for all energy requirement (Mu) energy availability (Mu)
uments (sBds) and allowing tariff revisions for awarded power proj- new generation and transmission projects of company owned
energy Shortage (Mu)
20 shaping new energy dimensions energising sustainable & prosperous Future 21