
Page 345 - Crisis in Higher Education
P. 345
Framing and Implementing a Practical Solution • 315
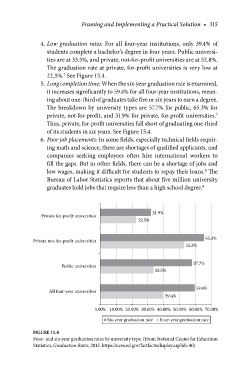
4. Low graduation rates: For all four-year institutions, only 39.4% of
students complete a bachelor’s degree in four years. Public universi-
ties are at 33.5%, and private, not-for-profit universities are at 52.8%.
The graduation rate at private, for-profit universities is very low at
22.5%. See Figure 15.4.
7
5. Long completion time: When the six-year graduation rate is examined,
it increases significantly to 59.4% for all four-year institutions, mean-
ing about one-third of graduates take five or six years to earn a degree.
The breakdown by university types are 57.7% for public, 65.3% for
private, not-for-profit, and 31.9% for private, for-profit universities.
7
Thus, private, for-profit universities fall short of graduating one-third
of its students in six years. See Figure 15.4.
6. Poor job placements: In some fields, especially technical fields requir-
ing math and science, there are shortages of qualified applicants, and
companies seeking employees often hire international workers to
fill the gaps. But in other fields, there can be a shortage of jobs and
8
low wages, making it difficult for students to repay their loans. The
Bureau of Labor Statistics reports that about five million university
graduates hold jobs that require less than a high school degree. 9
31.9%
Private for-profit universities
22.5%
65.3%
Private not-for-profit universities
52.8%
57.7%
Public universities
33.5%
59.4%
All four-year universities
39.4%
0.00% 10.00% 20.00% 30.00% 40.00% 50.00% 60.00% 70.00%
Six-year graduation rate Four-year graduation rate
FIGURE 15.4
Four- and six-year graduation rates by university type. (From National Center for Education
Statistics, Graduation Rates, 2015. https://nces.ed.gov/fastfacts/display.asp?id=40)