
Page 144 - An Introduction to Laser Tattoo Removal
P. 144
Chapter 2 – Fundamentals of Laser Tattoo Removal v1.0
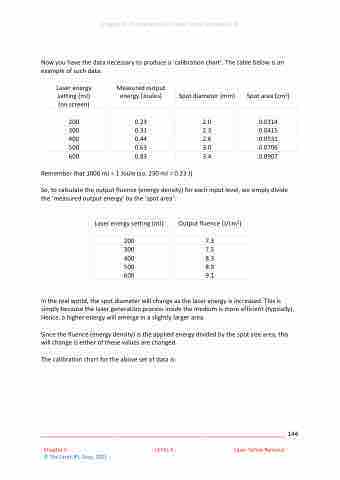
Now you have the data necessary to produce a ‘calibration chart’. The table below is an example of such data:
Laser energy setting (mJ) (on screen)
Measured output energy (Joules)
Spot diameter (mm)
Spot area (cm2)
200
0.23
2.0
0.0314
300
0.31
2.3
0.0415
400
0.44
2.6
0.0531
500
0.63
3.0
0.0706
600
0.83
3.4
0.0907
Remember that 1000 mJ = 1 Joule (so, 230 mJ = 0.23 J)
So, to calculate the output fluence (energy density) for each input level, we simply divide the ‘measured output energy’ by the ‘spot area’:
Laser energy setting (mJ)
Output fluence (J/cm2)
200
7.3
300
7.5
400
8.3
500
8.9
600
9.1
In the real world, the spot diameter will change as the laser energy is increased. This is simply because the laser generation process inside the medium is more efficient (typically). Hence, a higher energy will emerge in a slightly larger area.
Since the fluence (energy density) is the applied energy divided by the spot size area, this will change is either of these values are changed.
The calibration chart for the above set of data is:
________________________________________________________________________ 144
Chapter 2 LEVEL A Laser Tattoo Removal
© The Laser-IPL Guys, 2021
