
Page 145 - An Introduction to Laser Tattoo Removal
P. 145
Chapter 2 – Fundamentals of Laser Tattoo Removal v1.0
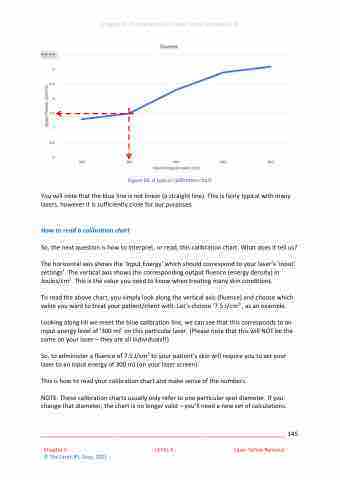
Figure 69: A typical calibration chart
You will note that the blue line is not linear (a straight line). This is fairly typical with many lasers, however it is sufficiently close for our purposes.
How to read a calibration chart
So, the next question is how to interpret, or read, this calibration chart. What does it tell us?
The horizontal axis shows the ‘Input Energy’ which should correspond to your laser’s ‘input’ settings’. The vertical axis shows the corresponding output fluence (energy density) in Joules/cm2. This is the value you need to know when treating many skin conditions.
To read the above chart, you simply look along the vertical axis (fluence) and choose which value you want to treat your patient/client with. Let’s choose ‘7.5 J/cm2’, as an example.
Looking along till we meet the blue calibration line, we can see that this corresponds to an input energy level of ‘300 mJ’ on this particular laser. (Please note that this will NOT be the same on your laser – they are all individuals!!)
So, to administer a fluence of 7.5 J/cm2 to your patient’s skin will require you to set your laser to an input energy of 300 mJ (on your laser screen).
This is how to read your calibration chart and make sense of the numbers.
NOTE: These calibration charts usually only refer to one particular spot diameter. If you change that diameter, the chart is no longer valid – you’ll need a new set of calculations.
________________________________________________________________________ 145
Chapter 2 LEVEL A Laser Tattoo Removal
© The Laser-IPL Guys, 2021
