
Page 101 - eProceeding for IRSTC2017 and RESPeX2017
P. 101
Syamsul Anuar / JOJAPS – JOURNAL ONLINE JARINGAN COT POLIPD
There are two types of analysis can be occupied that are quantitative and qualitative assessments. In this study, quantitative
assessments involved the calculation to the coordinate’s height. The qualitative assessment is more to analyze the quality of
orthophoto and DEM generation. The quantitative assessment is performing by using Root Mean Square Error (RMSE) formula
to calculate the accuracy of DEM. It is because DEM represents a topographical surface such as slope, aspect and spot height.
The height coordinates on the ground were compared with height coordinates values estimates established by photogrammetric
products. The formula or equation to calculate RMSE for height is shown in Equation (1) (Tahar et al., 2011). This study will
focus on height coordinates RMSE for the accuracy assessment.
i n
Z ( i Z ) 2
o
…………………………………..(1)
i 1
RMSEz = +
n
Where:
Zi = Observed heights from field survey
Zo = Observed heights from Agisoft Photoscan
n = Total number of points observation
Quantitative analysis can be done by calculating the data to get their RMSE value. Quantitative analyses in this study
generally are carried out by comparison height coordinates of points using leveling method and height coordinates of
photogrammetric products (UAV images processing based on leveling method) from Agisoft PhotoScan. Apart from that, the
accuracy of photogrammetric products using UAV images processing based on 10 GCPs and 5 GCPs towards RMSE value is
also studied.
4. Result and Analysis
Point analysis is carried out using Global Mapper software by overlay the orthophoto and DEM generated by Agisoft
PhotoScan. By combining orthophoto and DEM, the East, North and height coordinates of interest point can be determined.
Comparisons are made by comparing the control point’s coordinates digital photogrammetric products with the coordinates
gained from field survey.
There are seventeen (17) points have surveyed to use as ground control points and check points in this study. The points were
surveyed using RTK-GPS for positioning and leveling method for heights. The comparisons are made by comparing the
photogrammetric products using UAV images processing based on 10 GCPs and 5 GCPs. There are seven check points are used
to perform the comparison.
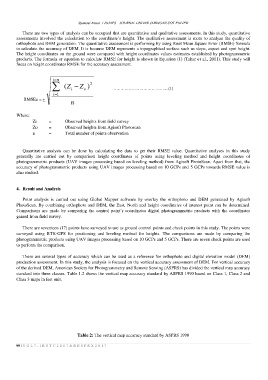
There are several types of accuracy which can be used as a reference for orthophoto and digital elevation model (DEM)
production assessment. In this study, the analysis is focused on the vertical accuracy assessment of DEM. For vertical accuracy
of the derived DEM, American Society for Photogrammetry and Remote Sensing (ASPRS) has divided the vertical map accuracy
standard into three classes. Table 1.2 shows the vertical map accuracy standard by ASPRS 1990 based on Class 1, Class 2 and
Class 3 maps in feet unit.
Table 2: The vertical map accuracy standard by ASPRS 1990
99 | V O L 7 - I R S T C 2 0 1 7 & R E S P E X 2 0 1 7