
Page 133 - eProceeding for IRSTC2017 and RESPeX2017
P. 133
Masliana, Nurul Izzah / JOJAPS – JOURNAL ONLINE JARINGAN COT POLIPD
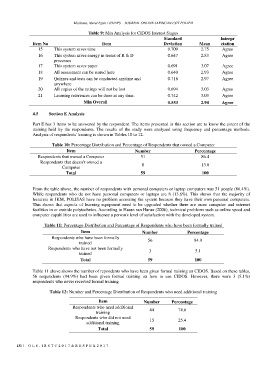
Table 9: Min Analysis for CIDOS Interest Stages
Standard Interpr
Item No Item Deviation Mean etation
15 This system saves time 0.709 2.75 Agree
16 This system saves energy in terms of R & D 0.647 2.83 Agree
processes
17 This system saves paper 0.691 3.07 Agree
18 All assessment can be stored here 0.640 2.93 Agree
19 Quizzes and tests can be conducted anytime and 0.718 2.97 Agree
anywhere
20 All copies of the ratings will not be lost 0.694 3.03 Agree
21 Learning references can be done at any time. 0.742 3.03 Agree
Min Overall 0.553 2.94 Agree
4.5 Section E Analysis
Part E has 3 items to be answered by the respondent. The items presented in this section are to know the extent of the
training held by the respondents. The results of the study were analyzed using frequency and percentage methods.
Analysis of respondents' training is shown in Tables 10 to 12.
Table 10: Percentage Distribution and Percentage of Respondents that owned a Computer
Item Number Percentage
Respondents that owned a Computer 51 86.4
Respondents that doesn’t owned a 8 13.6
Computer
Total 59 100
From the table above, the number of respondents with personal computers or laptop computers was 51 people (86.4%).
While respondents who do not have personal computers or laptops are 8 (13.6%). This shows that the majority of
lecturers in JKM, POLISAS have no problem accessing the system because they have their own personal computers.
This shows that aspects of learning equipment need to be upgraded whether there are more computer and internet
facilities in or outside polytechnics. According to Hasan san Harun (2006), technical problems such as online speed and
computer capabilities are used to influence a person's level of satisfaction with the developed system.
Table 11: Percentage Distribution and Percentage of Respondents who have been formally trained
Item Number Percentage
Respondents who have been formally
trained 56 94.9
Respondents who have not been formally 3 5.1
trained
Total 59 100
Table 11 above shows the number of repondents who have been given formal training on CIDOS. Based on these tables,
56 respondents (94.9%) had been given formal training on how to use CIDOS. However, there were 3 (5.1%)
respondents who never received formal training
Table 12: Number and Percentage Distribution of Respondents who need additional training
Item Number Percentage
Respondents who need additional 44 74.6
training
Respondents who did not need 15 25.4
additional training
Total 59 100
131 | V O L 8 - I R S T C 2 0 1 7 & R E S P E X 2 0 1 7