
Page 157 - eProceeding for IRSTC2017 and RESPeX2017
P. 157
MOHAMMAD FIRDAUS BIN AHMAD / JOJAPS – JOURNAL ONLINE JARINGAN COT POLIPD
Regression analysis
The regression will be used to test the hypothesis because the regression analysis can determine whether the independent
variables explain a significant variation in the dependent variables to find out whether the relationship exists or not.
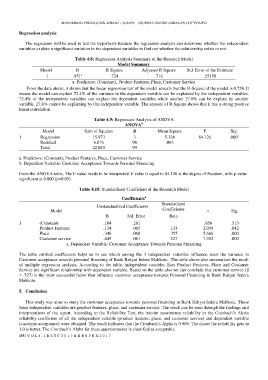
Table 4.8: Regression Analysis Summary of the Research Model
Model Summary
Model R R Square Adjusted R Square Std. Error of the Estimate
a
1 .851 .724 .716 .25158
a. Predictors: (Constant), Product Features, Place, Customer Service
From the data above, it shows that the linear regression test of the model reveals that the R-Square of the model is 0.724. It
means the model can explain 72.4% of the variance in the dependent variable can be explained by the independent variables.
72.4% of the independent variables can explain the dependent variables while another 27.6% can be explain by another
variable. 27.6% cannot be explaining by this independent variable. The amount of R-Square shows that it has a strong positive
linear correlation.
Table 4.9: Regression Analysis of ANOVA
b
ANOVA
Model Sum of Squares df Mean Square F Sig.
a
1 Regression 15.973 3 5.324 84.126 .000
Residual 6.076 96 .063
Total 22.049 99
a. Predictors: (Constant), Product Features, Place, Customer Service
b. Dependent Variable: Customer Acceptance Towards Personal Financing
From the ANOVA table, The F value needs to be interpreted. F value is equal to 84.126 at the degree of freedom, with p value
significant at 0.000 (p<0.05).
Table 4.10: Standardized Coefficient of the Research Model
a
Coefficients
Standardized
Unstandardized Coefficients
Model Coefficients t Sig.
B Std. Error Beta
1 (Constant) .184 .281 .656 .513
Product Features .134 .065 .133 2.059 .042
Place .340 .060 .355 5.666 .000
Customer service .449 .061 .527 7.352 .000
a. Dependent Variable: Customer Acceptance Towards Personal Financing
The table entitled coefficients helps us to see which among the 3 independent variables influence most the variance in
Customer acceptance towards personal financing of Bank Rakyat Indera Mahkota. The table above also summarizes the result
of multiple regression analysis. According to the table, independent variables likes Product Features, Place and Customer
Service are significant relationship with dependent variable. Based on the table also we can conclude that customer service (β
= .527) is the most successful factor that influence customer acceptance towards Personal Financing in Bank Rakyat Indera
Mahkota.
5. Conclusion
This study was aims to study the customer acceptance towards personal financing in Bank Rakyat Indera Mahkota. Those
three independent variables are product features, place, and customer service. The result can be seen through the findings and
interpretations of the report. According to the Reliability Test, the interim consistency reliability or the Cronbach’s Alpha
reliability coefficient of all the independent variable (product features, place, and customer service) and dependent variable
(customer acceptance) were obtained. The result indicates that the Cronbach’s Alpha is 0.909. The closer the reliability gets to
1.0 is better. The Cronbach’s Alpha for these questionnaires is classified as acceptable.
155 | V O L 8 - I R S T C 2 0 1 7 & R E S P E X 2 0 1 7