
Page 166 - eProceeding for IRSTC2017 and RESPeX2017
P. 166
Nur Aisah Ab.Moin / JOJAPS – JOURNAL ONLINE JARINGAN COT POLIPD
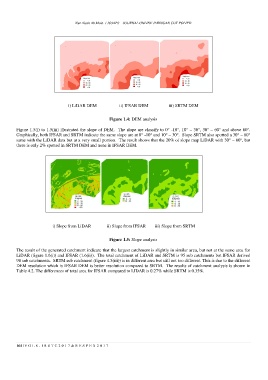
i) LiDAR DEM ii) IFSAR DEM iii) SRTM DEM
Figure 1.4: DEM analysis
Figure 1.5(i) to 1.5(iii) illustrated the slope of DEM. The slope are classify to 0° -10°, 10° – 30°, 30° – 60° and above 60°.
Graphically, both IFSAR and SRTM indicate the same slope are at 0° -10° and 10° – 30°. Slope SRTM also spotted a 30° – 60°
same with the LiDAR data but at a very small portion. The result shows that the 20% of slope map LiDAR with 30° – 60°, but
there is only 2% spotted in SRTM DEM and none in IFSAR DEM.
i) Slope from LiDAR ii) Slope from IFSAR iii) Slope from SRTM
Figure 1.5: Slope analysis
The result of the generated catchment indicate that the largest catchment is slightly in similar area, but not at the same area for
LiDAR (figure 1.6(i)) and IFSAR (1.6(ii)). The total catchment of LiDAR and SRTM is 95 sub catchments but IFSAR derived
98 sub catchments. SRTM sub catchment (figure 4.5(iii)) is in different area but still not too different. This is due to the different
DEM resolution which is IFSAR DEM is better resolution compared to SRTM. The results of catchment analysis is shown in
Table 4.2. The differences of total area for IFSAR compared to LIDAR is 0.27% while SRTM is 0.35%.
164 | V O L 8 - I R S T C 2 0 1 7 & R E S P E X 2 0 1 7