
Page 292 - eProceeding for IRSTC2017 and RESPeX2017
P. 292
Nor Hazlin Md Gharip / JOURNAL ONLINE JARINGAN COT POLIPD
Meanwhile 28% (17 respondents) are project manager and 15% (9 respondents) of the total 60 respondents represents director
of the companies including human resources manager, project director and Managing director. Since the number respondent from
of director quite low then respondents who derived also not from policy makers for the company in particular, but their
participation and observation in the course of duties at the company used as a basis for answering questions in the questionnaire
that was distributed.
4.1.2 Years of experience in construction industry
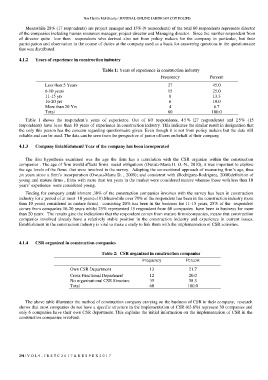
Table 1: Years of experience in construction industry
Frequency Percent
Less than 5 Years 27 45.0
6-10 years 15 25.0
11-15 yrs 8 13.3
16-20 yrs 6 10.0
More than 20 Yrs 4 6.7
Total 60 100.0
Table 1 shows the respondent’s years of experience. Out of 60 respondents, 45% (27 respondents) and 25% (15
respondents) have less than 10 years of experience in construction industry. This indicates the similar result in designation that
the only this person has the concern regarding questionnaire given. Even though it is not from policy makers but the data still
reliable and can be used. The data can be seen from the perspective of junior officers on behalf of their company
4.1.3 Company Establishment/ Year of the company has been incorporated
The first hypothesis examined was the age the firm has a correlation with the CSR organize within the construction
companies . The age of firm would affects firms social obligations (Owusu-Manu D. O.-N., 2010), it was important to explore
the age levels of the firms that were involved in the survey. Adopting the conventional approach of measuring firm’s age, thus
,in years since a firm’s incorporation (Owusu-Manu D. , 2009); and consistent with (Rodriguez-Rodriguez, 2008)definition of
young and mature firms , firms with more than ten years in the market were considered mature whereas those with less than 10
years’ experience were considered young.
Finding for company establishment ,30% of the construction companies involves with the survey has been in construction
industry for a period of at most 10 years(=10).Meanwhile over 70% of the respondent has been in the construction industry more
than 10 years( considered as mature firms). consisting 20% has been in the business for 11-15 years, 25% of the respondent
comes from companies 16-20 years whilst 25% represented 15 respondent from 60 companies have been in business for more
than 20 years. The results give the indications that the respondent comes from mature firms/companies, means that construction
companies involved already have a relatively stable position in the construction industry and experience in current issues.
Establishment in the construction industry is vital to make a study to link them with the implementation of CSR activities.
4.1.4 CSR organized in construction companies
Table 2: CSR organized in construction companies
Frequency Percent
Own CSR Department 13 21.7
Cross Functional Department 12 20.0
No organisational CSR Structure 35 58.3
Total 60 100.0
The above table illustrates the method of construction company carrying on the business of CSR in their company, research
shows that most companies do not have a specific structure in the implementation of CSR (63.8%) represent 30 companies and
only 6 companies have their own CSR department. This explains the initial information on the implementation of CSR in the
construction companies involved.
291 | V O L 9 - I R S T C 2 0 1 7 & R E S P E X 2 0 1 7