
Page 527 - eProceeding for IRSTC2017 and RESPeX2017
P. 527
Solly Aryza / JOJAPS – JOURNAL ONLINE JARINGAN COT POLIPD
Figure 1. General Optimization Process.
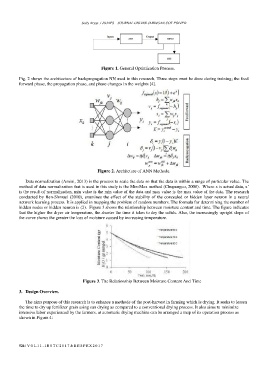
Fig. 2 shows the architecture of backpropagation NN used in this research. Three steps must be done during training; the feed
forward phase, the propagation phase, and phase changes in the weights [4].
Figure 2. Architcture of ANN Methode.
Data normalization (Amini, 2013) is the process to scale the data so that the data is within a range of particular value. The
method of data normalization that is used in this study is the Min-Max method (Chupungco, 2008). Where x is actual data, x’
is the result of normalization, min value is the min value of the data and max value is the max value of the data. The research
conducted by Ben-Shmuel (2010), examines the effect of the stability of the concealed or hidden layer neuron in a neural
network learning process. It is applied in mapping the problem of random numbers. The formula for determining the number of
hidden nodes or hidden neuron is (2). Figure 3 shows the relationship between moisture content and time. The figure indicates
that the higher the dryer air temperature, the shorter the time it takes to dry the solids. Also, the increasingly upright slope of
the curve shows the greater the loss of moisture caused by increasing temperature.
Figure 3. The Relationship Between Moisture Content And Time
3. Design Overview.
The aims purpose of this research is to enhance a methode of the post-harvest in farming which is drying. It seeks to lessen
the time to dry up fertilizer grain using sun drying as compared to a conventional drying process. It also aims to minimize
intensive labor experienced by the farmers. at automatic drying machine can be arranged a map of its operation process as
shown in Figure 4:
526 | V O L 1 1 - I R S T C 2 0 1 7 & R E S P E X 2 0 1 7