
Page 165 - eProceeding-IRSTC2017 & RESPEX2017
P. 165
Nur Aisah Ab.Moin / JOJAPS – JOURNAL ONLINE JARINGAN COT POLIPD
The LiDAR data is treated as the best quality data and accuracy when benchmarking the IFSAR and SRTM data. The topography
represent more accurately with higher resolution DEM (Saksena, 2014). From the literature review LiDAR best accuracy is
around 10cm in Z compared to IFSAR which is approximately 0.5m in Z (Dowman, 2003) while SRTM is expected to have 16m
vertical accuracy (Sandwell, 2002).
The surface models in this study are generated using raster and TIN. The data are converted into point data. The interpolation
of raster data is accomplished using Kriging method. Since IFSAR and SRTM in raster format, the processing is similar but it is
different for LiDAR data because it is a point cloud format (x,y,z). Each output were analysed in comparison between IFSAR
and SRTM compared with LiDAR. This phase involves a study of the implications and the difference from the comparison. A
comparative analysis conducted including profile analysis, DEM surface analysis, Point data analysis, flow direction analysis,
catchment and stream network analysis. The interview process is conducted to get an overview of the methodology and findings
of the study. Experts in the fields of hydrology has been selected to be interviewed about the suitability of the DEM from
LiDAR, IFSAR and SRTM in the field of hydrology focus on delineation watershed. Two experts from private company and
local university involve to proof the used of derive DEM from the sources of the data. The person of expertise on hydrology
whose has interviewed are Mr. Ahmad Zuhri Bin Ismail as a Managing Director of GeoEnvi Solution Sdn Bhd and Mr Kamarul
Azlan Bin Mohd Nasir (Senior Lecturer of Department of Hydraulics & Hydrology UTM).
4. Result & Analysis
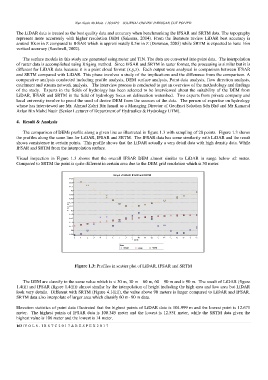
The comparison of DEMs profile along a given line as illustrated in figure 1.3 with sampling of 20 points. Figure 1.3 shows
the profiles along the same line for LiDAR, IFSAR and SRTM. The IFSAR data has some similarity with LiDAR and the result
shows consistence in certain points. This profile shows that the LiDAR actually a very detail data with high density data. While
IFSAR and SRTM from the interpolation surface.
Visual inspection in Figure 1.3 shows that the overall IFSAR DEM almost similar to LiDAR in range below ±2 meter.
Compared to SRTM the point is quite different in certain area due to the DEM grid resolution which is 30 meter.
Figure 1.3: Profiles in scatter plot of LiDAR, IFSAR and SRTM
The DEM are classify to the same value which is < 30 m, 30 m – 60 m, 60 – 90 m and > 90 m. The result of LiDAR (figure
1.4(i)) and IFSAR (figure 1.4(ii)) almost similar by the interpolation of height including the high area and low area but LiDAR
look very details. Different with SRTM (Figure 4.1(iii)), the value above 90 meters is larger compared to LiDAR and IFSAR.
SRTM data also interpolate of larger area which classify 60 m- 90 m data.
Elevation statistics of point data illustrated that the highest points of LiDAR data is 104.999 m and the lowest point is 12.671
meter. The highest points of IFSAR data is 100.345 meter and the lowest is 12.551 meter, while the SRTM data given the
highest value is 106 meter and the lowest is 14 meter.
163 | V O L 8 - I R S T C 2 0 1 7 & R E S P E X 2 0 1 7