
Page 88 - eProceeding-IRSTC2017 & RESPEX2017
P. 88
Che Ku Ahmad Fuad bin Che Ku Abdullah / JOJAPS – JOURNAL ONLINE JARINGAN COT POLIPD
Table 2: Comparison between the 3D model dataset and the reference dataset to calculate the residual.
Distance measurements
Total Station/ 3D Model
Bil Code Reference Residual (X)
1 a 2.711 2.720 0.0090
2 b 17.436 17.450 0.0140
3 c 5.900 5.910 0.0100
4 d 3.635 3.630 -0.0050
5 e 0.684 0.680 -0.0040
6 f 2.852 2.820 -0.0320
7 g 0.684 0.680 -0.0040
8 h 6.064 6.060 -0.0040
9 i 6.742 6.770 0.0280
10 j 4.887 4.900 0.0130
11 k 4.758 4.770 0.0120
12 l 2.711 2.754 0.0435
13 Window width 2 0.500 0.520 0.0200
14 Window width 1A 0.500 0.540 0.0400
15 Window width 5 2.900 2.800 -0.1000
16 Window width 4A 3.140 3.130 -0.0100
17 Window width 4C 1.120 1.160 0.0400
18 Door width 2 0.900 0.920 0.0200
19 Sliding Door width 1 3.260 3.290 0.0300
20 Sliding Door width 2 2.130 2.180 0.0500
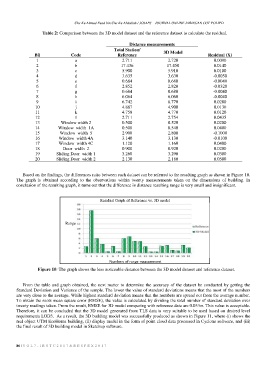
Based on the findings, the differences ratio between each dataset can be referred to the resulting graph as shown in Figure 10.
The graph is obtained according to the observations within twenty measurements taken on the dimensions of building. In
conclusion of the resulting graph, it turns out that the difference in distance resulting range is very small and insignificant.
Residual Graph of Reference vs. 3D model
Range
Numbers of range measurement
Figure 10: The graph shows the less noticeable distance between the 3D model dataset and reference dataset.
From the table and graph obtained, the next matter to determine the accuracy of the dataset be conducted by getting the
Standard Deviation and Variance of the sample. The lower the value of standard deviations means that the most of the numbers
are very close to the average. While highest standard deviation means that the numbers are spread out from the average number.
To obtain the roots mean square error (RMSE), the value is calculated by dividing the total number of standard deviation over
twenty readings taken. From the result, RMSE for 3D model comparing with reference data are 0.033m. This value is acceptable.
Therefore, it can be concluded that the 3D model generated from TLS data is very suitable to be used based on desired level
requirements LOD3. As a result, the 3D building model was successfully produced as shown in Figure 11, where (i) shows the
real object UTM EcoHome building, (ii) display model in the form of point cloud data processed in Cyclone software, and (iii)
the final result of 3D building model in Sketchup software.
86 | V O L 7 - I R S T C 2 0 1 7 & R E S P E X 2 0 1 7