
Page 101 - Cambridge+Checkpoint+Mathematics+Coursebook+9
P. 101
10.2 Using statistics
10.2 Using statistics
Now you can work out several di#erent statistical measures.
In a real situation, you need to decide which one to use.
If you want to measure how spread out a set of measurements is, the range is the most useful statistic.
If you want to "nd a representative measurement, you need an average. Should it be the mode, the
median or the mean? !at depends on the particular situation.
Here is a summary to help you decide which average to choose.
t Choose the mode if you want to know which is the most commonly occurring number.
t !e median is the middle value, when the data values are put in order. Half the numbers are greater
than the median and half the numbers are less than the median.
t !e mean depends on every value. If you change one number you change the mean.
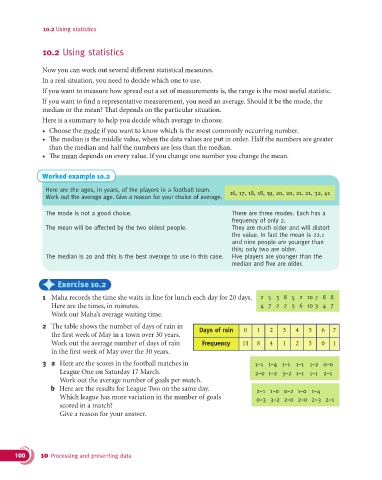
Worked example 10.2
Here are the ages, in years, of the players in a football team. 16, 17, 18, 18, 19, 20, 20, 21, 21, 32, 41
Work out the average age. Give a reason for your choice of average.
The mode is not a good choice. There are three modes. Each has a
frequency of only 2.
The mean will be affected by the two oldest people. They are much older and will distort
the value. In fact the mean is 22.1
and nine people are younger than
this; only two are older.
The median is 20 and this is the best average to use in this case. Five players are younger than the
median and five are older.
) Exercise 10.2
1 Maha records the time she waits in line for lunch each day for 20 days. 2 5 3 8 5 2 10 7 8 8
Here are the times, in minutes. 4 7 2 2 3 6 10 3 4 7
Work out Maha’s average waiting time.
2 The table shows the number of days of rain in Days of rain 0 1 2 3 4 5 6 7
the first week of May in a town over 30 years.
Work out the average number of days of rain Frequency 11 8 4 1 2 3 0 1
in the first week of May over the 30 years.
3 a Here are the scores in the football matches in 1−1 1−4 1−1 1−1 1−2 0−0
League One on Saturday 17 March. 2−0 1−2 3−2 1−1 1−1 2−1
Work out the average number of goals per match.
b Here are the results for League Two on the same day. 2−1 1−0 0−2 1−0 1−4
Which league has more variation in the number of goals 0−3 3−2 2−0 2−0 2−3 2−1
scored in a match?
Give a reason for your answer.
100 10 Processing and presenting data