
Page 60 - Cambridge+Checkpoint+Mathematics+Coursebook+9
P. 60
6.3 Designing data-collection sheets
6.3 Designing data-collection sheets
When you collect primary data you need to make sure it is easy to read and understand.
A data-collection sheet is a frequency table that you " ll in as people
give you the answers to your questions. It has three columns, one A frequency table is a table that
for listing the di$erent categories or answers, one for tally marks shows how frequently – or how
and one for the total number of tallies, or frequency. often – something occurs.
When you design a data-collection sheet, make sure that:
t it includes all possible answers
t each possible answer is only available in one tally box
t all the answers can be easily and quickly tallied.
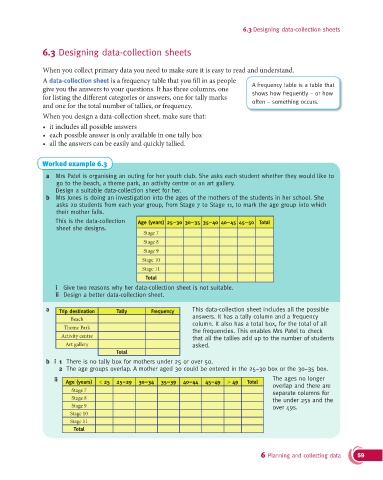
Worked example 6.3
a Mrs Patel is organising an outing for her youth club. She asks each student whether they would like to
go to the beach, a theme park, an activity centre or an art gallery.
Design a suitable data-collection sheet for her.
b Mrs Jones is doing an investigation into the ages of the mothers of the students in her school. She
asks 20 students from each year group, from Stage 7 to Stage 11, to mark the age group into which
their mother falls.
This is the data-collection Age (years) 25−30 30−35 35−40 40−45 45−50 Total
sheet she designs.
Stage 7
Stage 8
Stage 9
Stage 10
Stage 11
Total
i Give two reasons why her data-collection sheet is not suitable.
ii Design a better data-collection sheet.
a Trip destination Tally Frequency This data-collection sheet includes all the possible
Beach answers. It has a tally column and a frequency
column. It also has a total box, for the total of all
Theme Park
the frequencies. This enables Mrs Patel to check
Activity centre that all the tallies add up to the number of students
Art gallery asked.
Total
b i 1 There is no tally box for mothers under 25 or over 50.
2 The age groups overlap. A mother aged 30 could be entered in the 25−30 box or the 30−35 box.
ii Age (years) < 25 25−29 30−34 35−39 40−44 45−49 > 49 Total The ages no longer
overlap and there are
Stage 7
separate columns for
Stage 8 the under 25s and the
Stage 9 over 49s.
Stage 10
Stage 11
Total
6 Planning and collecting data 59