Page 3 - CP_Brochure_16_digital
P. 3

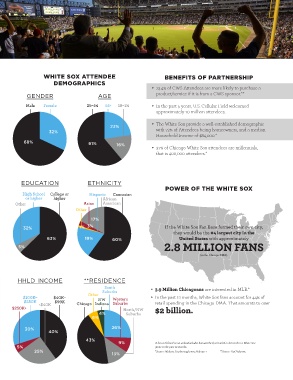
WHITE SOX ATTENDEE                                 BENEFITS OF PARTNERSHIP
                       DEMOGRAPHICS
                                                                •	73.4% of CWS Attendees are more likely to purchase a                                  South
            GENDER                        AGE                     product/service if it is from a CWS sponsor.**                                  Other  Suburbs
                                                                High School  College or     Hispanic  Caucasian       
		K       
	K              NW    Western
                                                                  or higher
                                                                             higher
                                                                                                  African
            Male   Female                 ­         •	In the past 5 years, U.S. Cellular Field welcomed    
	K  
	K  
K    Chicago Indiana  Suburbs
                                                             Other                        Asian   American        
	K
                                                                  approximately 10 million attendees.                                                           North/NW
                                                                                       Other                                                          4%         Suburbs
                                                                                                                                                   6%
                                                                •	The White Sox provide a well-established demographic
                                                                                             17%
                                               23%
                                                                  with 72% of Attendees being homeowners, and a median
                     32%                                         32%                    1%  3%                         30%       40%                       26%
                                                                  Household Income of $84,000.*
           68%                        61%         16%                      63%            19%         60%                                        43%          9%
                                                               5% •	37% of Chicago White Sox attendees are millennials,    5%  25%
                                                                  that is 400,000 attendees.*
                                                                                                                                                           13%
             GENDER                       AGE                    EDUCATION                   ETHNICITY                HHLD INCOME                **RESIDENCE
          EDUCATION                   ETHNICITY                                                   South
                                                                                                  Suburbs
                                                                      POWER OF THE WHITE SOX
           High School  College or    Hispanic  Caucasian       
		K       
	K          Other NW  Western
 Male  Female      ­  or higher  higher  African     
	K  
	K  
K    Chicago Indiana  Suburbs
       Other                        Asian   American        
	K                                        North/NW
                                 Other                                                          4%         Suburbs
                                                                                             6%
 23%                                   17%
                                                                                                     26%
 32%       32%                    1%  3%                         30%  If the White Sox Fan Base formed their own city,
                                                                           40%
                                                                         they would be the #4 largest city in the
                                                                                           43%
 68%  61%  16%       63%             19%        60%                         United States with approximately 9%
                                                                      2.8 MILLION FANS
                                                              5%
         5%                                                          25%
                                                                                     (in the Chicago DMA).  13%
 GENDER  AGE  EDUCATION                ETHNICITY                HHLD INCOME                **RESIDENCE

        HHLD INCOME                 **RESIDENCE
                                             South              •	3.9 Million Chicagoans are interested in MLB.*
                                            Suburbs
                                      Other
 High School  College or   Hispanic  Caucasian  
		K  
	K  NW  Western  •	In the past 12 months, White Sox fans account for 44% of
 Male  Female      ­  or higher  higher  African   
	K  
	K  
K  Chicago Indiana  Suburbs  retail spending in the Chicago DMA. That amounts to over
 Other  Asian  American  
	K                      North/NW     $2 billion.
 Other                                    4%          Suburbs
                                        6%
 23%  17%
 32%  32%  1%  3%  30%  40%                     26%

 68%  61%  16%  63%  19%  60%        43%           9%             A fan is defined as an individual who has watched, attended or listened to a White Sox
        5%                                                        game in the past 12 months.
 5%            25%                                                *Source: Nielson Scarborough 2015 Release 1   **Source: FanTrak2015
                                                13%


 GENDER  AGE  EDUCATION  ETHNICITY  HHLD INCOME  **RESIDENCE
   1   2   3   4   5   6   7   8