
Page 28 - 00 Introduccion_Abril 2022
P. 28
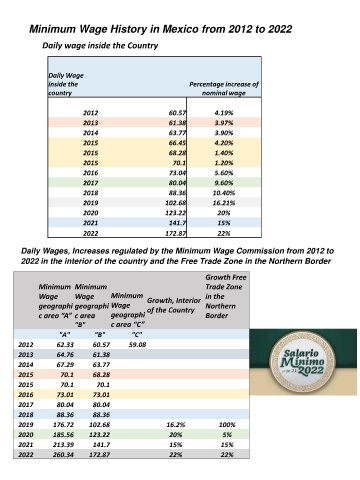
Minimum Wage History in Mexico from 2012 to 2022


              Daily wage inside the Country


                Daily Wage
                inside the                                Percentage increase of
                country                                       nominal wage


                          2012                      60.57        4.19%
                          2013                      61.38        3.97%
                          2014                      63.77        3.90%
                          2015                      66.45        4.20%
                          2015                      68.28        1.40%
                          2015                       70.1        1.20%
                          2016                      73.04        5.60%
                          2017                      80.04        9.60%
                          2018                      88.36        10.40%
                          2019                     102.68        16.21%
                          2020                     123.22         20%
                          2021                      141.7         15%
                          2022                     172.87         22%

       Daily Wages, Increases regulated by the Minimum Wage Commission from 2012 to
       2022 in the interior of the country and the Free Trade Zone in the Northern Border

                                                               Growth Free
             Minimum  Minimum                                  Trade Zone
             Wage      Wage       Minimum    Growth, Interior   in the
             geographi geographi Wage        of the Country    Northern
             c area “A” c area    geographi                    Border
                       "B"        c area “C”
                   "A"       "B"         "C"
       2012       62.33      60.57      59.08
       2013       64.76      61.38
       2014       67.29      63.77
       2015        70.1      68.28
       2015        70.1       70.1
       2016       73.01      73.01
       2017       80.04      80.04
       2018       88.36      88.36
       2019      176.72     102.68                 16.2%           100%
       2020      185.56     123.22                  20%             5%
       2021      213.39      141.7                  15%            15%
       2022      260.34     172.87                  22%            22%