Page 8 - annual report 2017 final
P. 8

7
                                                                   Southeast Louisiana Legal Services 2017 Annual Report


               2017 by the Numbers

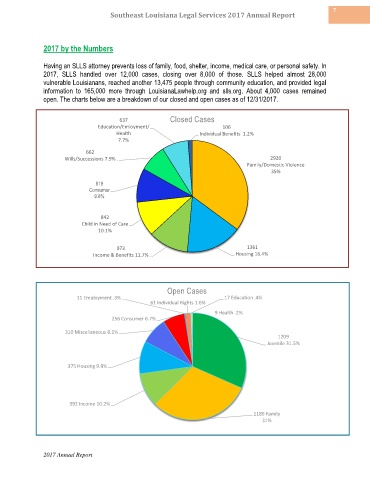
               Having an SLLS attorney prevents loss of family, food, shelter, income, medical care, or personal safety. In
               2017,  SLLS  handled  over  12,000  cases,  closing  over  8,000  of  those.  SLLS  helped  almost  28,000
               vulnerable Louisianans, reached another 13,475 people through community education, and provided legal
               information  to  165,000  more  through  LouisianaLawhelp.org  and  slls.org.  About  4,000  cases  remained
               open. The charts below are a breakdown of our closed and open cases as of 12/31/2017.


                                         637             Closed Cases
                                 Education/Emloyment/                      106
                                        Health                     Individual Benefits  1.2%
                                        7.7%

                             662
                      Wills/Successions 7.9%                                              2920
                                                                                   Family/Domestic Violence
                                                                                           35%
                                 819
                               Consumer
                                9.8%


                                  842
                            Child in Need of Care
                                  10.1%


                                        973                                        1361
                                Income & Benefits 11.7%                        Housing 16.4%


                                                        Open Cases
                          11 Employment .3%                                17 Education .4%
                                                   61 Individual Rights 1.6%
                                                                        9 Health .2%
                                      256 Consumer 6.7%

                       310 Miscellaneous 8.1%
                                                                                             1209
                                                                                         Juvenile 31.5%


                       375 Housing 9.8%


                        392 Income 10.2%
                                                                                     1186 Family
                                                                                        31%


               2017 Annual Report
   3   4   5   6   7   8   9   10   11   12   13