Page 359 - COSO Guidance
P. 359

Thought Leadership in ERM   |   Risk Assessment in Practice   |    17


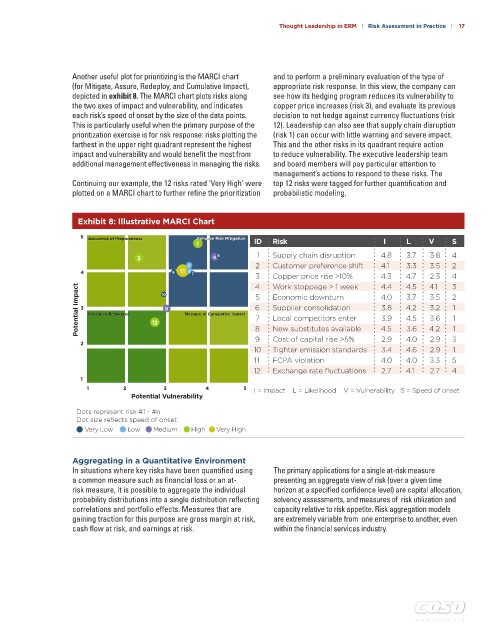
                   Another useful plot for prioritizing is the MARCI chart   and to perform a preliminary evaluation of the type of
                   (for Mitigate, Assure, Redeploy, and Cumulative Impact),   appropriate risk response. In this view, the company can
                   depicted in exhibit 8. The MARCI chart plots risks along   see how its hedging program reduces its vulnerability to
                   the two axes of impact and vulnerability, and indicates   copper price increases (risk 3), and evaluate its previous
                   each risk’s speed of onset by the size of the data points.   decision to not hedge against currency fluctuations (risk
                   This is particularly useful when the primary purpose of the   12). Leadership can also see that supply chain disruption
                   prioritization exercise is for risk response: risks plotting the   (risk 1) can occur with little warning and severe impact.
                   farthest in the upper right quadrant represent the highest   This and the other risks in its quadrant require action
                   impact and vulnerability and would benefit the most from   to reduce vulnerability. The executive leadership team
                   additional management effectiveness in managing the risks.  and board members will pay particular attention to
                                                                     management’s actions to respond to these risks. The
                   Continuing our example, the 12 risks rated ‘Very High’ were   top 12 risks were tagged for further quantification and
                   plotted on a MARCI chart to further refine the prioritization   probabilistic modeling.


                    Exhibit 8: Illustrative MARCI Chart

                     5  Assurance of Preparedness  Enhance Risk Mitigation
                       Assurance of Preparedness
                                                  Enhance Risk Mitigation
                                                  1             ID   Risk                       I     L    V     S
                                   3                  4 8         1   Supply chain disruption   4.8   3.7   3.8   4
                                                                 2   Customer preference shift   4.1   3.3   3.5   2
                                                2
                     4                      6 11 5 7             3   Copper price rise >10%    4.3    4.7   4.1   4
                                                                                                            2.3
                                                                 4
                                                                     Work stoppage > 1 week
                                                                                               4.4
                                                                                                      4.5
                                                                                                                 3
                    Potential Impact  3  Redeploy Resources  12  10 9  Measure of Cumulative Impact   5   Economic downturn   4.0   3.7   3.5   2
                                                                                                           3.2
                                                                                                                 1
                                                                                                      4.2
                                                                     Supplier consolidation
                                                                 6
                                                                                               3.8
                       Redeploy Resources
                                               Measure of Cumulative Impact
                                                                     Local competitors enter
                                                                                                                 1
                                                                                                           3.6
                                                                 7
                                                                                                      4.5
                                                                                               3.9
                                                                                                                 1
                                                                                                            2.9
                                                                     Cost of capital rise >5%
                                                                                                2.9
                                                                 9
                                                                                                      4.0
                     2                                           8   New substitutes available   4.5   3.6   4.2   3
                                                                10   Tighter emission standards    3.4   4.6   2.9   1
                                                                  11   FCPA violation          4.0    4.0   3.3   5
                                                                12    Exchange rate fluctuations    2.7   4.1   2.7   4
                     1
                       1        2         3         4        5  I = Impact    L = Likelihood    V = Vulnerability   S = Speed of onset
                                  Potential Vulnerability
                    Dots represent risk #1 - #n
                    Dot size reflects speed of onset:
                      Very Low   Low   Medium    High   Very High
                   Aggregating in a Quantitative Environment
                   In situations where key risks have been quantified using   The primary applications for a single at-risk measure
                   a common measure such as financial loss or an at-  presenting an aggregate view of risk (over a given time
                   risk measure, it is possible to aggregate the individual   horizon at a specified confidence level) are capital allocation,
                   probability distributions into a single distribution reflecting   solvency assessments, and measures of  risk utilization and
                   correlations and portfolio effects. Measures that are   capacity relative to risk appetite. Risk aggregation models
                   gaining traction for this purpose are gross margin at risk,   are extremely variable from  one enterprise to another, even
                   cash flow at risk, and earnings at risk.          within the financial services industry.


                                                                                                        w w w . c o s o . o r g
   354   355   356   357   358   359   360   361   362   363   364