
Page 9 - 2022 May Report
P. 9
Resilience
Theodore R. & Vivian M. Johnson Scholarship Founda
Profit and Loss
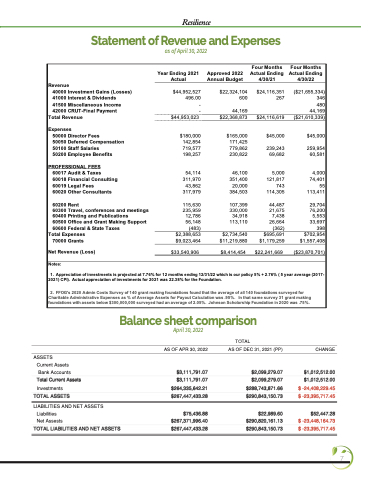
Statement of Revenue and Expenses
Four Months Ending April 30, 2022
as of April 30, 2022
Year Ending 2021 Actual
Revenue
40000 Investment Gains (Losses) $44,952,527 41000 Interest & Dividends 496.00 41500 Miscellaneous Income - 42000 CRUT-Final Payment -
Total Revenue $44,953,023
Expenses
50000 Director Fees $180,000 50050 Deferred Compensation 142,854 50100 Staff Salaries 719,577 50200 Employee Benefits 198,257
PROFESSIONAL FEES
60017 Audit & Taxes 54,114 60018 Financial Consulting 311,970 60019 Legal Fees 43,862 60020 Other Consultants 317,979
60200 Rent 115,630 60300 Travel, conferences and meetings 235,959 60400 Printing and Publications 12,786 60500 Office and Grant Making Support 56,148 60600 Federal & State Taxes (483)
Total Expenses $2,388,653 70000 Grants $9,023,464
Net Revenue (Loss) $33,540,906
Approved 2022 Annual Budget
$22,324,104 600
44,169 $22,368,873
$165,000 171,425 779,862 230,822
46,100 351,400 20,000 384,503
107,399 330,000 34,918 113,110
$2,734,540 $11,219,880
$8,414,454
Four Months Actual Ending 4/30/21
$24,116,351 267
$24,116,619
$45,000
239,243 69,682
5,000 121,817 743 114,305
44,487 21,675 7,438 26,664 (362) $695,691 $1,179,259
$22,241,669
Four Months Actual Ending 4/30/22
($21,655,334) 346 480 44,169 ($21,610,339)
$45,000
259,954 60,581
4,000 74,401 55 113,411
29,704 76,200 5,553 33,697 398 $702,954 $1,557,408
($23,870,701)
Notes:
1. Appreciation of investments is projected at 7.76% for 12 months ending 12/31/22 which is our policy 5% + 2.76% ( 5 year average (2017- 2021) CPI). Actual appreciation of investments for 2021 was 22.38% for the Foundation.
2. FFOG's 2020 Admin Costs Survey of 140 grant making foundations found that the average of all 140 foundations surveyed for Charitable Administrative Expenses as % of Average Assets for Payout Calculation was .95%. In that same survey 31 grant making
Theodore R. & Vivian M. Johnson Scholarship Foundation, Inc.
foundations with assets below $300,000,000 surveyed had an average of 2.05%. Johnson Scholarship Foundation in 2020 was .75%.
ASSETS Current Assets
Bank Accounts
Total Current Assets Investments
TOTAL ASSETS
LIABILITIES AND NET ASSETS
Liabilities
Net Assests
TOTAL LIABILITIES AND NET ASSETS
April 30, 2022
AS OF APR 30, 2022
$3,111,791.07 $3,111,791.07
$264,335,642.21 $267,447,433.28
$75,436.88 $267,371,996.40 $267,447,433.28
TOTAL
AS OF DEC 31, 2021 (PP)
$2,099,279.07 $2,099,279.07
$288,743,871.66 $290,843,150.73
$22,989.60 $290,820,161.13 $290,843,150.73
CHANGE
$1,012,512.00 $1,012,512.00
$ -24,408,229.45 $ -23,395,717.45
$52,447.28 $ -23,448,164.73 $ -23,395,717.45
Balance Sheet Comparison As of April 30, 2022
Balance sheet comparison
7
