
Page 42 - 2024 January report
P. 42
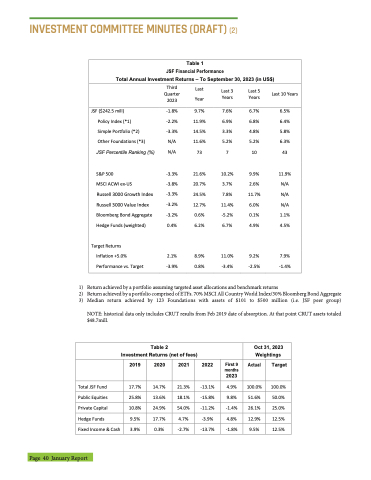
 INVESTMENT COMMITTEE MINUTES (DRAFT) (2)
Table 1
JSF Financial Performance
Total Annual Investment Returns – To September 30, 2023 (in US$)
 Third Last Last 3
Quarter Year Years 2023
Last 5 Years
6.7% 6.8% 4.8% 5.2% 10
9.9%
Last 10 Years
6.5% 6.4% 5.8% 6.3% 43
11.9% N/A
     JSF ($242.5 mill)
Policy Index (*1) Simple Portfolio (*2) Other Foundations (*3)
JSF Percentile Ranking (%)
S&P 500
MSCI ACWI ex-US
Russell 3000 Growth Index Russell 3000 Value Index Bloomberg Bond Aggregate Hedge Funds (weighted)
Target Returns
Inflation +5.0% Performance vs. Target
-1.8% -2.2% -3.3% N/A N/A
-3.3% -3.8% -3.3% -3.2% -3.2% 0.4%
2.1% -3.9%
9.7% 11.9% 14.5% 11.6% 73
21.6% 20.7% 24.5% 12.7%
7.6% 6.9% 3.3% 5.2% 7
10.2% 3.7% 7.8% 11.4%
2.6%
11.7% N/A
      0.6% -5.2% 6.2% 6.7%
8.9% 11.0% 0.8% -3.4%
6.0% N/A 0.1% 1.1% 4.9% 4.5%
9.2% 7.9% -2.5% -1.4%
 1) Return achieved by a portfolio assuming targeted asset allocations and benchmark returns
2) Return achieved by a portfolio comprised of ETFs. 70% MSCI All Country World Index/30% Bloomberg Bond Aggregate
3) Median return achieved by 123 Foundations with assets of $101 to $500 million (i.e. JSF peer group)
NOTE: historical data only includes CRUT results from Feb 2019 date of absorption. At that point CRUT assets totaled $48.7mill.
  Table 2
Investment Returns (net of fees)
Oct 31, 2023 Weightings
        2019
17.7% 25.8% 10.8% 9.5% 3.9%
2020
14.7% 13.6% 24.9% 17.7% 0.3%
2021
21.3% 18.1% 54.0% 4.7% -2.7%
2022
First 9 months 2023
Actual
Target
100.0% 50.0% 25.0% 12.5% 12.5%
        Total JSF Fund
Public Equities Private Capital Hedge Funds
Fixed Income & Cash
-13.1%
-15.8% 9.8% 51.6% -11.2% -1.4% 26.1%
-3.9% 4.8% 12.9% -13.7% -1.8% 9.5%
4.9%
100.0%
                                         Page 40 January Report
