
Page 11 - January 2023 Report
P. 11
Johnson Scholarship Foundation
Resilience
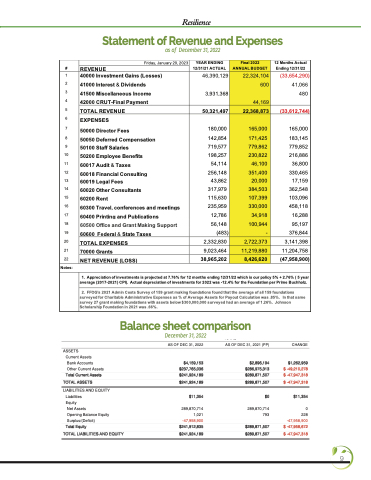
Statements of Revenue & Expenses Stat1e2mMoennthtsoEnfdRineg vDecnemubera3n1d, 2E02x2penses
as of December 31, 2022
#
REVENUE
Friday, January 20, 2023 YEAR ENDING 12/31/21 ACTUAL
TOTAL REVENUE
TOTAL EXPENSES
2,332,830
70000 Grants
9,023,464
50,321,497
Final 2022 ANNUAL BUDGET
22,368,873
165,000
171,425 779,862 230,822
46,100 351,400
20,000 384,503 107,399 330,000
34,918 100,944 -
2,722,373
11,219,880
12 Months Actual Ending 12/31/22
1 2 3 4 5 6
EXPENSES
40000 Investment Gains (Losses) 41000 Interest & Dividends
41500 Miscellaneous Income 42000 CRUT-Final Payment
(33,612,744)
165,000
183,145 779,852 216,886
36,800 330,465
17,159 362,548 103,096 458,118
16,288
95,197 376,844
3,141,398
11,204,758
Notes:
NET REVENUE (LOSS)
38,965,202
1. Appreciation of investments is projected at 7.76% for 12 months ending 12/31/22 which is our policy 5% + 2.76% ( 5 year average (2017-2021) CPI). Actual depreciation of investments for 2022 was -12.4% for the Foundation per Prime Buchholz.
Balance Sheet
46,390,129
3,931,368
22,324,104 600
44,169
8,426,620
(33,654,290)
41,066 480
7 50000 Director Fees
8 50050 Deferred Compensation
9 50100 Staff Salaries
10 50200 Employee Benefits
11 60017 Audit & Taxes
12 60018 Financial Consulting
13 60019 Legal Fees
14 60020 Other Consultants
15 60200 Rent
16 60300 Travel, conferences and meetings
17 60400 Printing and Publications
18 60500 Office and Grant Making Support
19 60600 Federal & State Taxes
20 21 22
180,000
142,854 719,577 198,257
54,114 256,148
43,862 317,979 115,630 235,959
12,786 56,148
(483)
(47,958,900)
2. FFOG's 2021 Admin Costs Survey of 159 grant making foundations found that the average of all 159 foundations
surveyed for Charitable Administrative Expenses as % of Average Assets for Payout Calculation was .85%. In that same
Johnson Scholarship Foundation
survey 27 grant making foundations with assets below $300,000,000 surveyed had an average of 1.26%. Johnson
Scholarship Foundation in 2021 was .66%.
As of December 31, 2022
Balance sheet comparison
ASSETS
Total Current Assets
TOTAL ASSETS
LIABILITIES AND EQUITY Liabilities
Equity
Net Assets
Opening Balance Equity Surplus/(Deficit)
Total Equity
TOTAL LIABILITIES AND EQUITY
December 31, 2022
AS OF DEC 31, 2022
$4,159,153 $237,765,036 $241,924,189 $241,924,189
$11,354 289,870,714
1,021
-47,958,900
$241,912,835 $241,924,189
TOTAL
AS OF DEC 31, 2021 (PP)
$2,896,194 $286,975,313 $289,871,507 $289,871,507
$0 289,870,714
793
$289,871,507 $289,871,507
CHANGE
1/20/23
$1,262,959 -49,210,278 -47,947,318 -47,947,318
$11,354 0
228
-47,958,900
-47,958,672 -47,947,318
2023 JSF .xlsx
Current Assets
Bank Accounts Other Current Assets
$ $ $
$ $
9
