
Page 886 - Adams and Stashak's Lameness in Horses, 7th Edition
P. 886
852 Chapter 7
therefore provide support to the metacarpophalangeal the typical strain that a tendon undergoes at a walk and
and metatarsophalangeal joints during weight‐bearing and trot. However, as strains reach 5% and 6%, the tendon
VetBooks.ir unexpected movement. 24 changes. When the tendon reaches 10%–12% strain
is more viscoelastic, which results in permanent
exercise and act as force transmitters during rapid and
31
(ultimate tensile strain), permanent catastrophic changes
Tendons should also be considered as elastic struc
tures that store energy for efficient locomotion. 1,32 such as rupture result. That said, maximum strains in
Structures such as the SDFT provide shock absorption Thoroughbreds at a gallop can reach 16%. 19,24 These
through the elasticity of the tendon combined with the are much greater than the strains most other species
attachment of the musculotendinous portion to the cau sustain at higher speeds and quite possibly explain why
dal aspect of the radius by the accessory or superior racing Thoroughbreds sustain a much greater incidence
check ligament. The undulating gait of a horse at speed of disease affecting the SDFT.
has been compared to the motion of a pogo stick with The SDFT sustains loads of up to 1 metric ton at
the tendons providing the elasticity of the bounce. The maximum weight‐bearing. Considering that the
32
45
unique structural arrangement within tendons and liga maximal cross section is approximately 1 cm in cross‐
2
ments allows the horse to exercise at high speeds while sectional area, it is little surprise that mid‐metacarpal
minimizing energy expenditure. 32 tendon injury is so prevalent. Variability in ultimate ten
sile force exists within any population of horses, how
ever, with up to a twofold difference reported between
BIOMECHANICAL PROPERTIES weak and strong tendons. 46
The modulus of elasticity/stiffness is represented by
Biomechanical characteristics of tendons are usually the force required to extend the tendon by a unit length.
described by stress–strain curves. These curves reveal the The stronger the tendon, the stiffer it is. Hysteresis
32
force per unit area (stress) plotted against the percentage refers to the phase between loading and unloading a
of elongation (strain) and can be used to calculate elastic tendon and importantly results in loss of energy. It is
modulus (Figure 7.57). The four areas that are impor estimated that approximately 5% hysteresis occurs
31
tant to a stress–strain curve of a tendon are: in equine tendon, increasing the temperature within
1. The toe region, where stretch is nonlinear. This repre the tendon core when repeated loads are applied to the
sents the area where the undulating pattern of colla tendon during exercise and possibly causing flexor
gen fibrils are eliminated; this is also the elastic phase. tendinitis (Figure 7.58). 44
2. Linear deformation, or midsection, where the elastic
stiffness of the tendon is represented.
3. Yield region, in which irreversible lengthening of the TYPES OF TENDON AND LIGAMENT INJURIES
tendon occurs and the plastic phase begins.
4. Rupture, in which the collagen cross‐links or fibrils Three types of injury may occur in tendons and liga
sequentially rupture. ments: excessive strain, physical tearing, and percutane
ous injury. Overstrain may result from overwhelming
Initially, the tendon is highly compliant, but upon the resistive strength in an acute manner, and it is
further extension, stiffness increases and viscoelastic believed to be the most common reason for ligament
(and permanent) changes occur. 24,42 It has been sug and tendon injuries in the horse. Strain‐induced inju
32
gested that the second phase of the stress–strain curve ries are believed to occur after a phase of molecular
for a tendon causes residual damage. When the strain degeneration or inflammation that is not clinically
41
level is maintained between 3% and 5%, the normal
linear stress–strain relationship is maintained; this is
6
5
Tendon
rupture 4
Force (KN) 3 Dissipation
Stress 2 energy
1
Linear
Toe region
region 0
0 2 4 6 8
Strain (%)
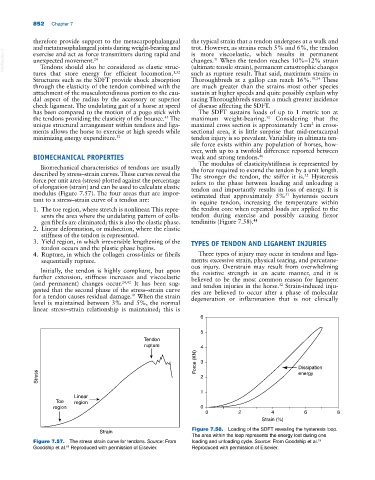
Figure 7.58. Loading of the SDFT revealing the hysteresis loop.
Strain
The area within the loop represents the energy lost during one
Figure 7.57. The stress strain curve for tendons. Source: From loading and unloading cycle. Source: From Goodship et al.
19
19
Goodship et al. Reproduced with permission of Elsevier. Reproduced with permission of Elsevier.