Page 78 - Live-cellanalysis handbook
P. 78

Live-Cell Analysis Handbook — Third Edition


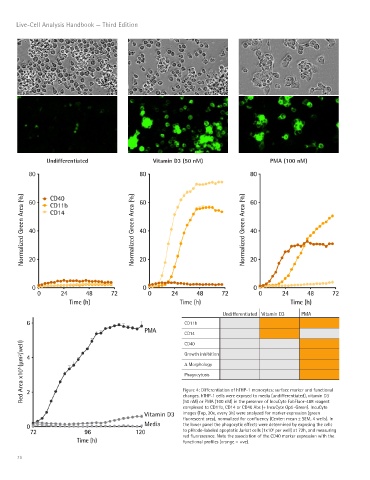
                Undifferentiated                    Vitamin D3 (50 nM)                    PMA (100 nM)


                                                                           Undifferentiated Vitamin D3  PMA
                                                              CD11b
                                                              CD14
                                                              CD40
                                                              Growth inhibition
                                                              Δ Morphology

                                                              Phagocytosis

                                                              Figure 4: Differentiation of hTHP-1 monocytes: surface marker and functional
                                                              changes. hTHP-1 cells were exposed to media (undifferentiated), vitamin D3
                                                              (50 nM) or PMA (100 nM) in the presence of IncuCyte FabFluor-488 reagent
                                                              complexed to CD11b, CD14 or CD40 Abs (+ IncuCyte Opti-Green). IncuCyte
                                                              images (Top, 20x, every 3h) were analyzed for marker expression (green
                                                              fluorescent area), normalized for confluency (Center: mean ± SEM, 4 wells). In
                                                              the lower panel the phagocytic effects were determined by exposing the cells
                                                              to pHrodo-labeled apoptotic Jurkat cells (1x10  per well) at 72h, and measuring
                                                                                           6
                                                              red fluorescence. Note the association of the CD40 marker expression with the
                                                              functional profiles (orange = +ve).

       76
   73   74   75   76   77   78   79   80   81   82   83