
Page 386 - Small Animal Clinical Nutrition 5th Edition
P. 386
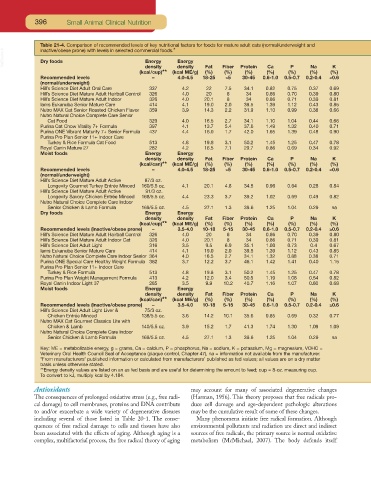
396        Small Animal Clinical Nutrition


                    Table 21-4. Comparison of recommended levels of key nutritional factors for foods for mature adult cats (normal/underweight and
                    inactive/obese prone) with levels in selected commercial foods.*
        VetBooks.ir  Dry foods                         Energy    Energy

                                                       density
                                                                 density
                                                                                                              Na
                                                                                                                     K
                                                                                               Ca
                                                                                                       P
                                                     (kcal/cup)**  (kcal ME/g)  Fat   Fiber   Protein  (%)  (%)  (%)  (%)
                                                                                 (%)
                                                                                        (%)
                                                                           (%)
                    Recommended levels                   –        4.0-4.5  18-25  ≤5   30-45  0.6-1.0  0.5-0.7  0.2-0.4  ≥0.6
                    (normal/underweight)
                    Hill’s Science Diet Adult Oral Care   337      4.2     22    7.5    34.1   0.82   0.75   0.37   0.69
                    Hill’s Science Diet Mature Adult Hairball Control   326  4.0  20  8  34    0.86   0.70   0.39   0.80
                    Hill’s Science Diet Mature Adult Indoor   326  4.0    20.1    8     34     0.86   0.71   0.39   0.81
                    Iams Eukanuba Senior Mature Care    414        4.1    19.0   2.0    39.5   1.39   1.12   0.43   0.85
                    Nutro MAX Cat Senior Roasted Chicken Flavor  359  3.9  14.3  2.2    31.9   1.10   0.99   0.38   0.66
                    Nutro Natural Choice Complete Care Senior
                      Cat Food                          329        4.0    16.5   2.7    34.1   1.10   1.04   0.44   0.66
                    Purina Cat Chow Vitality 7+ Formula  397       4.1    13.7   5.4    37.6   1.49   1.32   0.40   0.71
                    Purina ONE Vibrant Maturity 7+ Senior Formula  437  4.4  16.0  1.7  42.0   1.65   1.39   0.48   0.90
                    Purina Pro Plan Senior 11+ Indoor Care
                      Turkey & Rice Formula Cat Food    513        4.8    19.8   3.1    50.2   1.45   1.25   0.47   0.78
                    Royal Canin Mature 27               282        4.2    16.5   7.1    29.7   0.86   0.69   0.34   0.92
                    Moist foods                        Energy    Energy
                                                       density   density    Fat   Fiber   Protein  Ca   P     Na     K
                                                     (kcal/can)**  (kcal ME/g)  (%)  (%)  (%)  (%)    (%)     (%)   (%)
                    Recommended levels                   –        4.0-4.5  18-25  ≤5   30-45  0.6-1.0  0.5-0.7  0.2-0.4  ≥0.6
                    (normal/underweight)
                    Hill’s Science Diet Mature Adult Active   87/3 oz.
                      Longevity Gourmet Turkey Entrée Minced  160/5.5 oz.  4.1  20.1  4.8  34.5  0.96  0.64  0.28   0.84
                    Hill’s Science Diet Mature Adult Active  91/3 oz.
                      Longevity Savory Chicken Entrée Minced  168/5.5 oz.  4.4  23.3  3.7  39.2  1.02  0.69  0.49   0.82
                    Nutro Natural Choice Complete Care Indoor
                      Senior Chicken & Lamb Formula   169/5.5 oz.  4.5    27.1   1.3    39.6   1.25   1.04   0.29    na
                    Dry foods                          Energy    Energy
                                                       density   density    Fat   Fiber   Protein  Ca   P     Na     K
                                                     (kcal/cup)**  (kcal ME/g)  (%)  (%)  (%)  (%)    (%)     (%)   (%)
                    Recommended levels (inactive/obese prone)  –  3.5-4.0  10-18  5-15  30-45  0.6-1.0  0.5-0.7  0.2-0.4  ≥0.6
                    Hill’s Science Diet Mature Adult Hairball Control   326  4.0  20  8  34    0.86   0.70   0.39   0.80
                    Hill’s Science Diet Mature Adult Indoor Cat   326  4.0  20.1  8     34     0.86   0.71   0.39   0.81
                    Hill’s Science Diet Adult Light     316        3.5     9.5   6.9    35.1   1.00   0.73    0.4   0.67
                    Iams Eukanuba Senior Mature Care    414        4.1    19.0   2.0    39.5   1.39   1.12   0.43   0.85
                    Nutro Natural Choice Complete Care Indoor Senior 364  4.0  16.5  2.7  34.1  1.32  0.88   0.38   0.71
                    Purina ONE Special Care Healthy Weight Formula 362  3.7  12.2  3.7  46.1   1.42   1.41   0.40   1.15
                    Purina Pro Plan Senior 11+ Indoor Care
                      Turkey & Rice Formula             513        4.8    19.8   3.1    50.2   1.45   1.25   0.47   0.78
                    Purina Pro Plan Weight Management Formula  413  4.2   12.0   3.4    50.5   1.19   1.08   0.54   0.82
                    Royal Canin Indoor Light 37         285        3.5     9.9   10.2   40.7   1.16   1.07   0.80   0.68
                    Moist foods                        Energy    Energy
                                                       density   density    Fat   Fiber   Protein  Ca   P     Na     K
                                                     (kcal/can)**  (kcal ME/g)  (%)  (%)  (%)  (%)    (%)     (%)   (%)
                    Recommended levels (inactive/obese prone)  –  3.5-4.0  10-18  5-15  30-45  0.6-1.0  0.5-0.7  0.2-0.4  ≥0.6
                    Hill’s Science Diet Adult Light Liver &   75/3 oz.
                      Chicken Entrée Minced           138/5.5 oz.  3.6    14.2   10.1   35.6   0.85   0.69   0.32   0.77
                    Nutro MAX Cat Gourmet Classics Lite with
                      Chicken & Lamb                  140/5.5 oz.  3.9    15.2   1.7    41.3   1.74   1.30   1.09   1.09
                    Nutro Natural Choice Complete Care Indoor
                      Senior Chicken & Lamb Formula   169/5.5 oz.  4.5    27.1   1.3    39.6   1.25   1.04   0.29    na
                    Key: ME = metabolizable energy, g = grams, Ca = calcium, P = phosphorus, Na = sodium, K = potassium, Mg = magnesium, VOHC =
                    Veterinary Oral Health Council Seal of Acceptance (plaque control, Chapter 47), na = information not available from the manufacturer.
                    *From manufacturers’ published information or calculated from manufacturers’ published as fed values; all values are on a dry matter
                    basis unless otherwise stated.
                    **Energy density values are listed on an as fed basis and are useful for determining the amount to feed; cup = 8-oz. measuring cup.
                    To convert to kJ, multiply kcal by 4.184.

                  Antioxidants                                        may account for many of associated degenerative changes
                  The consequences of prolonged oxidative stress (e.g., free radi-  (Harman, 1956). This theory proposes that free radicals pro-
                  cal damage) to cell membranes, proteins and DNA contribute  duce cell damage and age-dependent pathologic alterations
                  to and/or exacerbate a wide variety of degenerative diseases  may be the cumulative result of some of these changes.
                  including several of those listed in  Table 20-1. The conse-  Many phenomena initiate free radical formation. Although
                  quences of free radical damage to cells and tissues have also  environmental pollutants and radiation are direct and indirect
                  been associated with the effects of aging. Although aging is a  sources of free radicals, the primary source is normal oxidative
                  complex, multifactorial process, the free radical theory of aging  metabolism (McMichael, 2007). The body defends itself