
Page 103 - C:\Users\Teresa\Documents\Flip PDF\Southern PPI\
P. 103
Rehabilitation
Services
PROFIT & LOSS STATEMENT STUDENT DEMOGRAPHICS
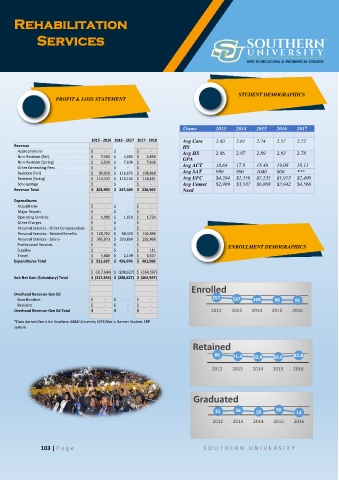
/Name 2013 2014 2015 2016 2017
2015 - 2016 2016 - 2017 2017 - 2018 Avg Core 2.60 2.61 2.74 2.57 2.72
Revenue HS
Appropriations $ - $ - $ - Avg HS 2.86 2.87 2.89 2.83 2.78
Non-Resident (Fall) $ 7,194 $ 4,980 $ 2,698 GPA
Non-Resident (Spring) $ 2,539 $ 7,636 $ 7,636 Avg ACT 18.64 17.8 18.48 19.09 18.11
Other Generating Fees $ - $ - $ -
Resident (Fall) $ 80,929 $ 116,672 $ 108,468 Avg SAT 990 890 1040 800 ***
Resident (Spring) $ 113,332 $ 118,161 $ 118,161 Avg EFC $4,284 $1,356 $7,235 $1,973 $2,406
Scholarships $ - $ - $ - Avg Unmet $2,989 $3,587 $6,868 $3,942 $4,566
Revenue Total $ 203,993 $ 247,449 $ 236,963 Need
Expenditures
Acquisitions $ - $ - $ -
Major Repairs $ - $ - $ -
Operating Services $ 1,096 $ 1,618 $ 1,754
Other Charges $ - $ - $ -
Personal Services - Other Compensation $ - $ - $ -
Personal Services - Related Benefits $ 128,782 $ 98,420 $ 102,890
Personal Services - Salary $ 385,873 $ 353,899 $ 292,468
Professional Services $ - $ - $ - ENROLLMENT DEMOGRAPHICS
Supplies $ - $ - $ 111
Travel $ 5,886 $ 2,139 $ 4,337
Expenditures Total $ 521,637 $ 456,076 $ 401,560
$ (317,644) $ (208,627) $ (164,597)
Sub Net Gain (Subsidiary) Total $ (317,644) $ (208,627) $ (164,597)
Enrolled
Overhead Revenue-Gen Ed
Non-Resident $ - $ - $ - 157 127 105 98 91
Resident $ - $ - $ -
Overhead Revenue-Gen Ed Total $ - $ - $ - 2012 2013 2014 2015 2016
*Data derived from the Southern A&M University SSPS files in Banner Student ERP
system.
Retained
88 71.4 63.6 63.6 81.8
2012 2013 2014 2015 2016
Graduated
21 26 18 30 14
2012 2013 2014 2015 2016
103 | P a g e S O U T H E R N U N IVE R S IT Y