
Page 36 - C:\Users\Teresa\Documents\Flip PDF\Southern PPI\
P. 36
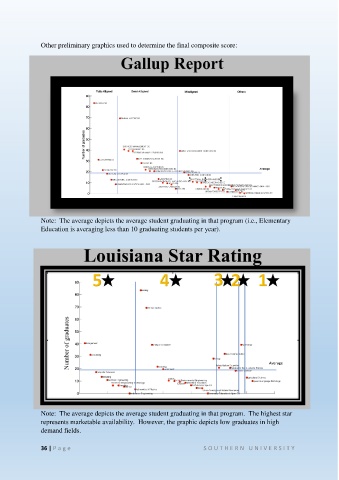
Other preliminary graphics used to determine the final composite score:


               Note:  The average depicts the average student graduating in that program (i.e., Elementary
               Education is averaging less than 10 graduating students per year).


               Note:  The average depicts the average student graduating in that program.  The highest star
               represents marketable availability.  However, the graphic depicts low graduates in high
               demand fields.


               36 | P a ge                                                       S O U T H E R N  U N IVE R S IT Y