
Page 83 - Chemistry
P. 83
(i) The number of moles of hyrdrochloric acid used
3
(ii) The number of moles of sodium hydroxide in 20cm
3
(iii) The moles of sodium hydroxide in 250cm of solution
3
(iv) The mass in grams of sodium hydroxide in 250cm of solution
(v) The solubility of sodium hydroxide in g/100g water
15. a) Define the term solubility of a substance
b) The table below shows the solubilities of two salts L and M at different temperatures.
Temperature(ºC) 10 20 30 40 50
Solubility in g/100g L 11.0 14.0 20.1 28.0 36.0
of water. M 15.0 17.0 19.0 21.2 25.0
i) Name the method that can be used to separate the two salts
ii) Plot on the same axes a graph of solubilities of L and M against temperature
iii) From the graph determine:-
The temperature at which solubilities are equal
The solubility at the temperature mentioned above
iv) If the relative formula mass of M is 132, determine the concentration of M in moles per litre
in (iii) II above
3
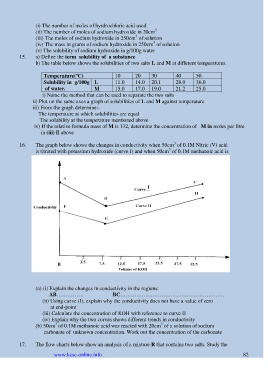
16. The graph below shows the changes in conductivity when 50cm of 0.1M Nitric (V) acid
3
is titrated with potassium hydroxide (curve I) and when 50cm of 0.1M methanoic acid is
reacted with the same potassium hydroxide solution (curve II)
I
0
(a) (i) Explain the changes in conductivity in the regions:
AB…………… BC………………………………………………….
(ii) Using curve (I), explain why the conductivity does not have a value of zero
at end-point
(iii) Calculate the concentration of KOH with reference to curve II
(iv) Explain why the two curves shows different trends in conductivity
3
3
(b) 50cm of 0.1M methanoic acid was reacted with 20cm of a solution of sodium
carbonate of unknown concentration. Work out the concentration of the carbonate
17. The flow charts below show an analysis of a mixture R that contains two salts. Study the
www.kcse-online.info 82