
Page 24 - UKZN MIMI Report 2025
P. 24
knowledge, and there is evidence that this knowledge is used to develop new practices and improve service delivery. Innovation receives support at certain leadership levels, further enabling its integration into municipal operations.
The majority – 74% of municipalities – were on Maturity Level 2 (Table 12) which means that in most of the municipalities that participated in the MIMI, innovation is only defined and understood, but there is no evidence of implementation.
Lastly, Table 12 shows that only 3 municipalities (Nala, Nyandeni and Umzumbe) were on Maturity Level 1, the minimum maturity level. The score of 1 means that innovation in these municipalities is limited, if present at all. There is minimal awareness or evidence of innovation among individual officials or within the organisation as a whole. The importance of innovation is not yet adequately recognised. At Maturity Level 1, the municipality shows only limited processes, awareness, and understanding related to innovation. It has not established any formal processes for innovation, nor has it implemented performance measurements, rules and procedures, or allocated resources— whether human, financial, or infrastructural—to support innovative efforts. Collaboration and the flow of ideas are minimal, and officials are not actively involved in innovation. Technology projects are neither tested nor supported. The municipality does not actively seek innovative solutions and lacks systems and business processes to record, store, or retrieve knowledge. As a result, knowledge is not applied to develop new practices or improve service delivery.
7.3 MIMI Maturity Levels by Province
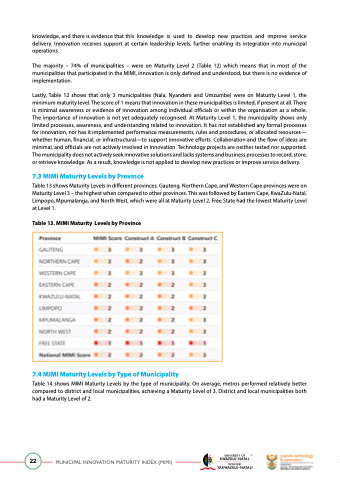
Table 13 shows Maturity Levels in different provinces. Gauteng, Northern Cape, and Western Cape provinces were on Maturity Level 3 – the highest when compared to other provinces. This was followed by Eastern Cape, KwaZulu-Natal, Limpopo, Mpumalanga, and North West, which were all at Maturity Level 2. Free State had the lowest Maturity Level at Level 1.
Table 13. MIMI Maturity Levels by Province
7.4 MIMI Maturity Levels by Type of Municipality
Table 14 shows MIMI Maturity Levels by the type of municipality. On average, metros performed relatively better compared to district and local municipalities, achieving a Maturity Level of 3. District and local municipalities both had a Maturity Level of 2.
22
MUNICIPAL INNOVATION MATURITY INDEX (MIMI)
