
Page 366 - CEO Orientation
P. 366
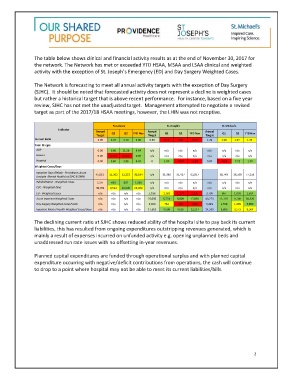
The table below shows clinical and financial activity results as at the end of November 30, 2017 for
               the network. The Network has met or exceeded YTD HSAA, MSAA and LSAA clinical and weighted
               activity with the exception of St. Joseph’s Emergency (ED) and Day Surgery Weighted Cases.


               The Network is forecasting to meet all annual activity targets with the exception of Day Surgery
               (SJHC).  It should be noted that forecasted activity does not represent a decline is weighted cases
               but rather a historical target that is above recent performance.  For instance, based on a five year
               review, SJHC has not met the unadjusted target.  Management attempted to negotiate a revised
               target as part of the 2017/18 HSAA meetings, however, the LHIN was not receptive.


                                                Providence             St. Joseph's           St. Michael's
                         Indicator
                                         Annual  Q1  Q2  YTD Nov  Annual  Q1  Q2  YTD Nov  Annual   Q1  Q2  YTD Nov
                                         Target                Target                  Target
                Current Ratio             2.00   2.64   2.10   2.08   0.80   0.70   0.60   0.59   1.36   1.08   1.07  1.33
                Total Margin
                ADP                       0.00   6.80   11.26   9.64   n/a  n/a  n/a  n/a  n/a  n/a  n/a  n/a
                Houses                    0.00   (1.10)  (0.03)  0.05   n/a  n/a  n/a  n/a  n/a  n/a  n/a  n/a
                Hospital                  0.00   3.60   3.96   4.47   0   1.80  -6.50  -1.60  0.00  -0.26  7.72  1.70
                Weighted Cases/Days
                Inpatient Days (Rehab - Providence; Acute   45,611  11,362   11,222   30,184   n/a  31,390   31,427   62,817   38,749  38,509  77,258
                (exclude  Mental Health) at SJHC & SMH)
                Rehabilitation - Weighted Cases  2,311  690  687  1,860  n/a  n/a  n/a  n/a  n/a  n/a  n/a  n/a
                CCC - Weighted Days      39,704  9,523  10,045  26,069  n/a  n/a  n/a  n/a  n/a  n/a  n/a  n/a
                ED - Weighted Cases       n/a   n/a  n/a  n/a  5,186  1,183  1,174  3,135  3,700  967  1,003  2,624
                Acute Inpatient Weighted Cases  n/a  n/a  n/a  n/a  25,000  6,774  6,689  17,850  43,273  11,116  11,341  30,220
                Day Surgery Weighted Cases/Visits  n/a  n/a  n/a  n/a  3,360  754  626  1,873  5,449  1,558  1,305  3,889

                Inpatient Mental Health Weighted Cases/Days  n/a  n/a  n/a  n/a  17,663  4,508  4,626  12,217  14,500  3,806  3,573  9,564
               The declining current ratio at SJHC shows reduced ability of the hospital site to pay back its current
               liabilities, this has resulted from ongoing expenditures outstripping revenues generated, which is
               mainly a result of expenses incurred on unfunded activity e.g. opening unplanned beds and
               unaddressed run rate issues with no offsetting in-year revenues.


               Planned capital expenditures are funded through operational surplus and with planned capital
               expenditure occurring with negative/deficit contributions from operations, the cash will continue
               to drop to a point where hospital may not be able to meet its current liabilities/bills.


                                                                                                           2