
Page 140 - Six Sigma Advanced Tools for Black Belts and Master Black Belts
P. 140
Char Count= 0
August 31, 2006
JWBK119-09
2:57
Simulation Study 125
Weibull (1.0, 2.0)
2.6
2.4
2.2
2.0
C pu 1.8
1.6 C pu = 1.667
1.4
1.2
1.0
0.8
Assumed Distribution Clements’ Johnson
normal free tolerance method transform
Probability Weighted Box-Cox Wright’s
plot variance transform index
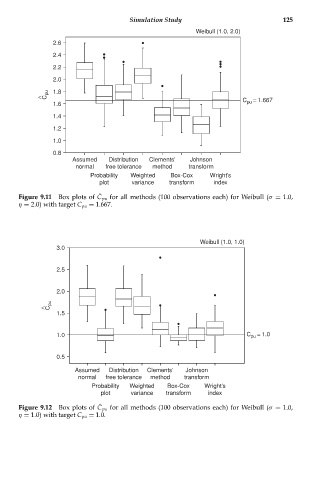
Figure 9.11 Box plots of ˆ C pu for all methods (100 observations each) for Weibull (σ = 1.0,
η = 2.0) with target C pu = 1.667.
Weibull (1.0, 1.0)
3.0
2.5
2.0
C pu
1.5
1.0 C pu = 1.0
0.5
Assumed Distribution Clements’ Johnson
normal free tolerance method transform
Probability Weighted Box-Cox Wright’s
plot variance transform index
Figure 9.12 Box plots of ˆ C pu for all methods (100 observations each) for Weibull (σ = 1.0,
η = 1.0) with target C pu = 1.0.