
Page 17 - NASC Safety Report 2022
P. 17
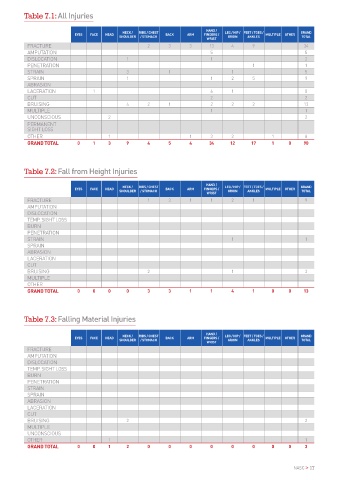
Table 7.1: All Injuries
 Analysis of Injuries    FRACTURE  EYES  FACE  HEAD  SHOULDER  RIBS / CHEST   BACK  ARM  FINGERS /   LEG / HIP /  FEET / TOES /   MULTIPLE  OTHER  GRAND
                                                                         HAND /
                                            NECK /
                                                                                        ANKLES
                                                                                 GROIN
                                                                                                           TOTAL
                                                  / STOMACH
                                                                          WRIST
                                                     2
                                                                    3
                                                            3
                                                                                                            34
                                                                                          9
                                                                           13
                                                                                  4
 to Operatives  AMPUTATION                   1                             5 1            1                 5 2 1
           DISLOCATION
           PENETRATION
           STRAIN
           SPRAIN                            3 1            1              1      1 2     5                 5 9
           ABRASION
 The following tables and charts give a breakdown of all the injuries reported, identifying the type of    LACERATION  1  6  1  8
 injury sustained, the part of the body affected and in some instances the ages of the operatives injured.  CUT  2  2
           BRUISING                          4       2      1              2      2       2                 13
           MULTIPLE                                                        1                                1
           UNCONSCIOUS                 2                                                                    2
 Table 7.1 shows the most common   FALLING MATERIALS  SLIPS AND TRIPS ON THE SAME LEVEL  PERMANENT
 injury sustained was a fracture   SIGHT LOSS
 (34), followed by bruising (13) and a   Table 7.3 shows there were three   Table 7.5 shows injuries suffered as   OTHER  1  1  3  2  1  8
 sprain (9). The most common body   injuries cause by falling materials,   a result of a slip or trip on the same   GRAND TOTAL  0  1  3  9  4  5  4  34  12  17  1  0  90
 part injured was hand, fingers and   two resulted in bruising, while   level. The most common injury was
 wrist (34), feet, toes and ankles (17)   one operative suffered a mild   a fracture (7), followed by a sprain
 and leg, hip and groin (12).   concussion.   (6) and bruising (3).
 FALLS FROM HEIGHT  MANUAL HANDLING  The 21-30 age bracket (8 of the 24   Table 7.2: Fall from Height Injuries
 instances) and 31-40 (7) suffered the
 There were 13 falls from height by   There were 26 instances of manual   most slips or trips. See chart below   NECK /   RIBS / CHEST   HAND /   LEG / HIP /  FEET / TOES /   GRAND
 persons (shown in Table 7.2), the   handling injuries (see Table 7.4 and   for more.   EYES  FACE  HEAD  SHOULDER  / STOMACH  BACK  ARM  FINGERS /   GROIN  ANKLES  MULTIPLE  OTHER  TOTAL
                                                                          WRIST
 same as recorded in 2020.   FRACTURE
 the middle chart below) recorded in                 1      3       1      1      2       1                 9
 These 13 incidents caused   2021.   AMPUTATION
 operatives to be absent from work   DISLOCATION
 for a total of 843 days.   These incidents caused operatives   TEMP. SIGHT LOSS
 to be absent from work a total of   BURN
 Nine of these (69% of the total)   770 days. The most common injury   PENETRATION
 resulted in fractures. Three caused   was a fracture (7), followed by   STRAIN   1                         1
 bruising and the remaining incident   SPRAIN
 resulted in a sprain.   lacerations (5) and then strains,   ABRASION
 bruising and other (all 3).   LACERATION
 The falls were primarily split across   CUT
 three age brackets (see chart   Employees aged between 31 and 40   BRUISING  2   1                         3
 below), with 21-30 responsible for   (10) and 21 and 30 (9) suffered the   MULTIPLE
 four falls and both 31-40 and 51-60   vast majority of the total manual   OTHER
 accounting for three falls.   handling injuries.  GRAND TOTAL  0  0  0  0  3  3  1  1  4  1    0     0     13


          Table 7.3: Falling Material Injuries
 INJURIES RESULTING FROM FALLS    INJURIES RESULTING FROM MANUAL   INJURIES RESULTING FROM SLIPS
 FROM HEIGHT  HANDLING  AND TRIPS                                        HAND /
                                            NECK /
                           EYES  FACE  HEAD  SHOULDER  RIBS / CHEST   BACK  ARM  FINGERS /   LEG / HIP /  FEET / TOES /   MULTIPLE  OTHER  GRAND
                                                  / STOMACH
                                                                                        ANKLES
                                                                                 GROIN
                                                                                                           TOTAL
                                                                          WRIST
           FRACTURE
 61+  51-60  61+ 16-20  61+  16-20  AMPUTATION
           DISLOCATION
 16-20     TEMP. SIGHT LOSS
 41-50  51-60  BURN
 21-30     PENETRATION
 51-60     STRAIN
 21-30  41-50  21-30  SPRAIN
           ABRASION
 31-40     LACERATION
 41-50  31-40  31-40  CUT                    2                                                              2
           BRUISING
           MULTIPLE
           UNCONSCIOUS
           OTHER                       1                                                                    1
           GRAND TOTAL      0     0    1     2       0      0       0      0      0       0     0     0     3


 16 > NASC                                                                                              NASC > 17