
Page 6 - Demo
P. 6
Vaccines 2021, 9, 226
6 of 12
A total of 521 (24.4%) participants had a chronic disease and 1216 (56.9%) previously re- ceived a flu vaccination, whereas 419 (19.6%) previously refused a physician-recommended vaccine. A total of 291 (13.6%) participants had previously contracted COVID-19, and 843 (39.4%) had a family member who had previously contracted COVID-19. Only 765 (35.8%) participants believed that the COVID-19 vaccine should be compulsory. In terms of per- ceived risk, 870 (40.7%) participants perceived a low or very low risk of contracting COVID-19, and 894 (41.8%) perceived that COVID-19 poses a significant or major risk to the people of Saudi Arabia.
As shown in Table 1, it was found that gender, education level, employment status, region of residence, having received the flu vaccination in the past, having previously refused a vaccination recommended by a physician, perceived risk of COVID-19 to people in Saudi Arabia, concerns about contracting COVID-19, and support for compulsory vaccination were all statistically significant at the 1% level.
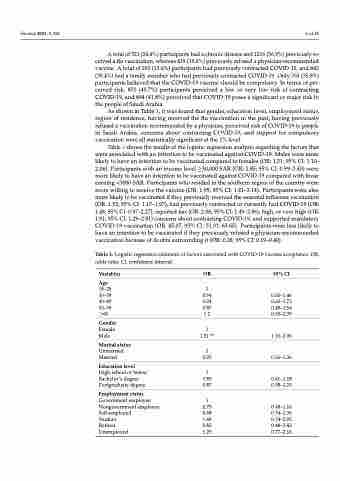
Table 2 shows the results of the logistic regression analysis regarding the factors that were associated with an intention to be vaccinated against COVID-19. Males were more likely to have an intention to be vaccinated compared to females (OR: 1.51; 95% CI: 1.10– 2.06). Participants with an income level ≥30,000 SAR (OR: 1.85; 95% CI: 0.99–3.45) were more likely to have an intention to be vaccinated against COVID-19 compared with those earning <3000 SAR. Participants who resided in the southern region of the country were more willing to receive the vaccine (OR: 1.95; 95% CI: 1.21–3.14). Participants were also more likely to be vaccinated if they previously received the seasonal influenza vaccination (OR: 1.52; 95% CI: 1.17–1.97), had previously contracted or currently had COVID-19 (OR: 1.48; 95% CI: 0.97–2.27), reported fair (OR: 2.06; 95% CI: 1.49–2.86), high, or very high (OR: 1.91; 95% CI: 1.29–2.81) concerns about contracting COVID-19, and supported mandatory COVID-19 vaccination (OR: 45.07; 95% CI: 31.91–63.65). Participants were less likely to have an intention to be vaccinated if they previously refused a physician-recommended vaccination because of doubts surrounding it (OR: 0.28; 95% CI: 0.19–0.40).
Table 2. Logistic regression estimates of factors associated with COVID-19 vaccine acceptance. OR, odds ratio; CI, confidence interval.
Variables
Age
18–29 30–39 40–49 50–59 ≥60
Gender
Female Male
Marital status
Unmarried Married
Education level
High school or below Bachelor’s degree Postgraduate degree
Employment status
Government employee Nongovernment employee Self-employed
Student
Retired Unemployed
OR
1 0.94 1.04 0.87 1.2
1 1.51 **
1 0.95
1 0.85 0.87
1 0.75 0.68 1.48 0.83 1.29
95% CI
0.60–1.46 0.63–1.71 0.49–1.54 0.60–2.39
1.10–2.06
0.66–1.36
0.61–1.18 0.58–1.29
0.48–1.16 0.34–1.36 0.74–2.95 0.48–1.43 0.77–2.16
